
- Start >
- Rivers >
- Discharge >
- Untere Donau >
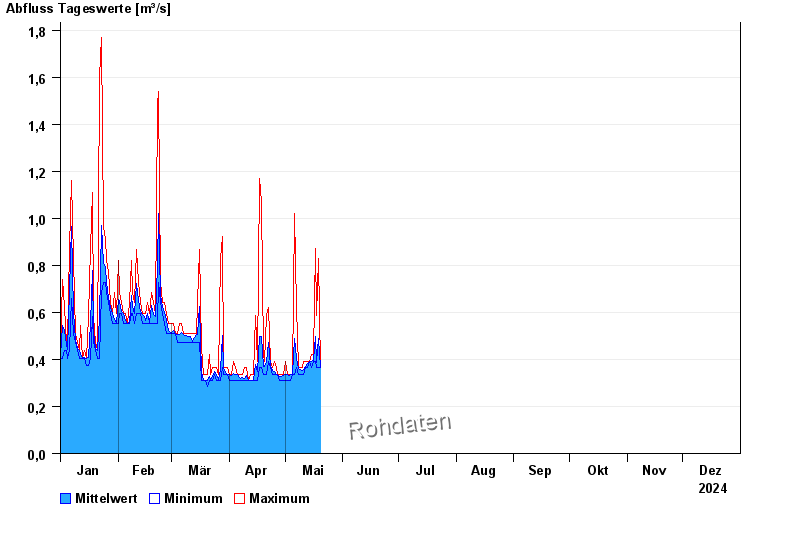
- Wolnzach >
- Chart of year

Chart of year Wolnzach / Wolnzach
Discharge from 01.01.2024 to 31.12.2024
 Für diesen Pegel sind keine -Sommer hinterlegt.
| Date | Mean value [m³/s] | Maximum [m³/s] | Minimum [m³/s] |
|---|---|---|---|
| 29.05.2024 | 0.32 | 0.336 | 0.309 |
| 28.05.2024 | 0.455 | 0.872 | 0.309 |
| 27.05.2024 | 0.333 | 0.484 | 0.309 |
| 26.05.2024 | 0.36 | 0.392 | 0.336 |
| 25.05.2024 | 0.983 | 2.82 | 0.392 |
| 24.05.2024 | 0.507 | 4.26 | 0.364 |
| 23.05.2024 | 0.393 | 0.452 | 0.364 |
© Bayerisches Landesamt für Umwelt 2024