
- Start >
- Rivers >
- Discharge >
- Untere Donau >
- Wallersdorf >
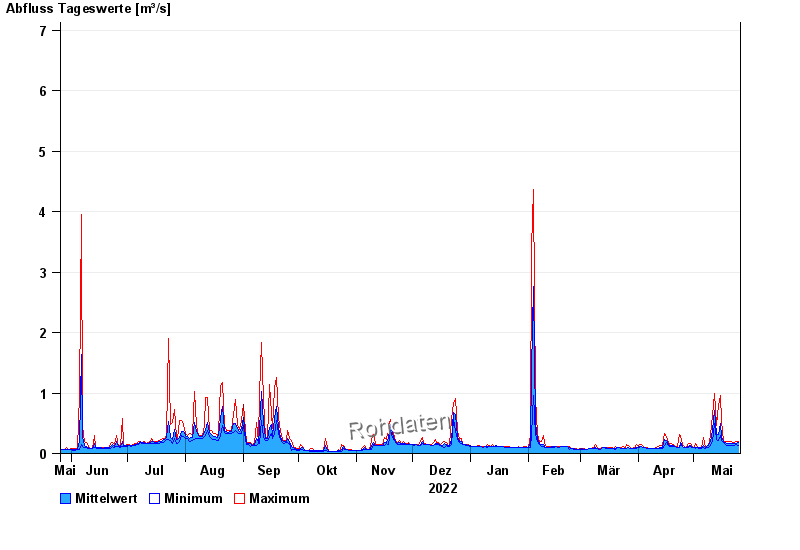
- Chart of year

Chart of year Wallersdorf / Reißingerbach
Discharge from 26.05.2022 to 25.05.2023
- 14.01.2011 Abfluss: 13,6 m³/s
- 03.06.2013 Abfluss: 13,1 m³/s
- 16.02.2006 Abfluss: 11,9 m³/s
- 04.08.1991 Abfluss: 10,8 m³/s
- 11.11.2002 Abfluss: 10,6 m³/s
| Date | Mean value [m³/s] | Maximum [m³/s] | Minimum [m³/s] |
|---|---|---|---|
| 25.05.2023 | 0.175 | 0.196 | 0.14 |
| 24.05.2023 | 0.168 | 0.196 | 0.152 |
| 23.05.2023 | 0.164 | 0.181 | 0.14 |
| 22.05.2023 | 0.163 | 0.181 | 0.14 |
| 21.05.2023 | 0.168 | 0.196 | 0.14 |
| 20.05.2023 | 0.169 | 0.196 | 0.14 |
| 19.05.2023 | 0.172 | 0.196 | 0.14 |
© Bayerisches Landesamt für Umwelt 2024