
- Start >
- Rivers >
- Discharge >
- Untere Donau >
- Wallersdorf >
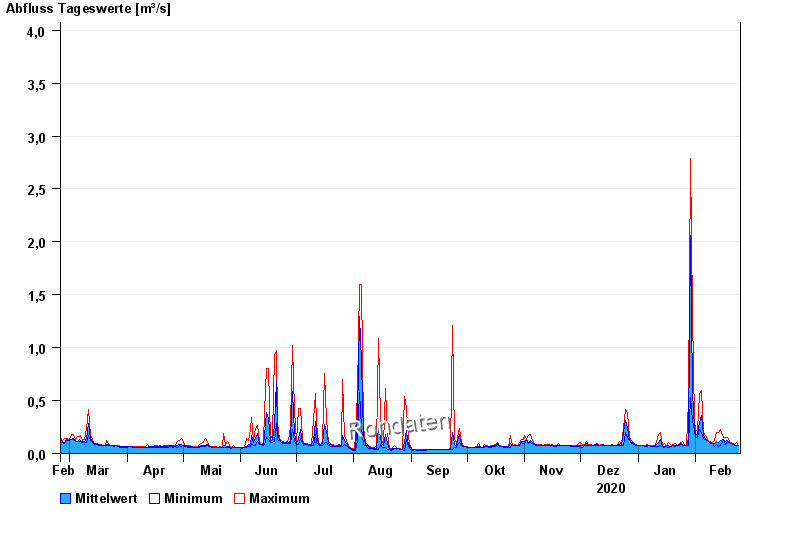
- Chart of year

Chart of year Wallersdorf / Reißingerbach
Discharge from 25.02.2020 to 24.02.2021
- 14.01.2011 Abfluss: 13,6 m³/s
- 03.06.2013 Abfluss: 13,1 m³/s
- 16.02.2006 Abfluss: 11,9 m³/s
- 04.08.1991 Abfluss: 10,8 m³/s
- 11.11.2002 Abfluss: 10,6 m³/s
| Date | Mean value [m³/s] | Maximum [m³/s] | Minimum [m³/s] |
|---|---|---|---|
| 24.02.2021 | 0.079 | 0.079 | 0.079 |
| 23.02.2021 | 0.08 | 0.102 | 0.079 |
| 22.02.2021 | 0.085 | 0.086 | 0.079 |
| 21.02.2021 | 0.088 | 0.094 | 0.086 |
| 20.02.2021 | 0.098 | 0.102 | 0.094 |
| 19.02.2021 | 0.108 | 0.112 | 0.102 |
| 18.02.2021 | 0.124 | 0.155 | 0.112 |
© Bayerisches Landesamt für Umwelt 2024