
- Start >
- Rivers >
- Discharge >
- Untere Donau >
- Wallersdorf >
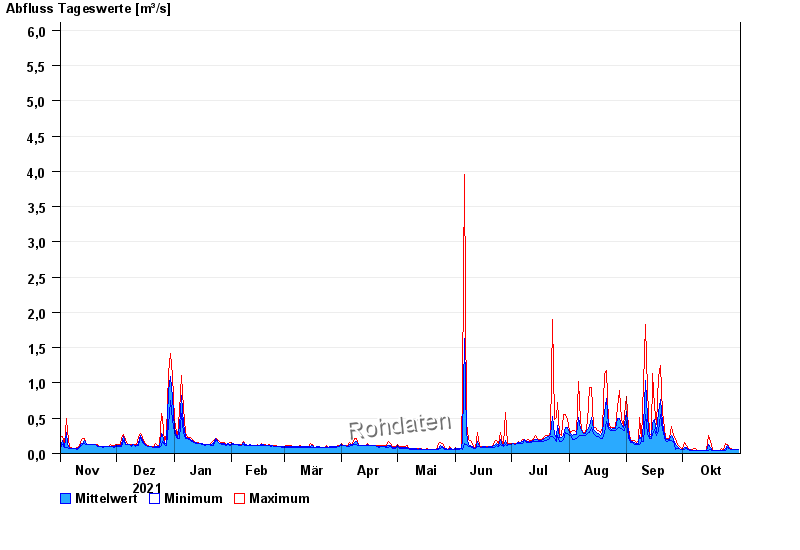
- Chart of year

Chart of year Wallersdorf / Reißingerbach
Discharge from 01.11.2021 to 31.10.2022
- 14.01.2011 Abfluss: 13,6 m³/s
- 03.06.2013 Abfluss: 13,1 m³/s
- 16.02.2006 Abfluss: 11,9 m³/s
- 04.08.1991 Abfluss: 10,8 m³/s
- 11.11.2002 Abfluss: 10,6 m³/s
| Date | Mean value [m³/s] | Maximum [m³/s] | Minimum [m³/s] |
|---|---|---|---|
| 31.10.2022 | 0.053 | 0.054 | 0.05 |
| 30.10.2022 | 0.054 | 0.054 | 0.054 |
| 29.10.2022 | 0.055 | 0.06 | 0.054 |
| 28.10.2022 | 0.056 | 0.06 | 0.054 |
| 27.10.2022 | 0.062 | 0.065 | 0.06 |
| 26.10.2022 | 0.071 | 0.085 | 0.065 |
| 25.10.2022 | 0.108 | 0.129 | 0.085 |
© Bayerisches Landesamt für Umwelt 2024