
- Start >
- Rivers >
- Discharge >
- Untere Donau >
- Vilsbiburg >
- Chart of year

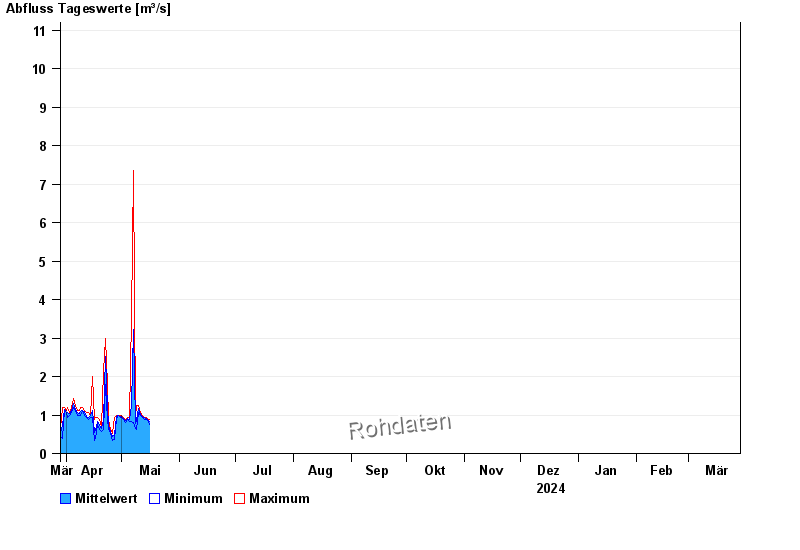
Chart of year Vilsbiburg / Große Vils
Discharge from 29.03.2024 to 28.03.2025
- 09.07.1954 Abfluss: 151 m³/s
- 16.06.1951 Abfluss: 113 m³/s
- 20.02.1999 Abfluss: 112 m³/s
- 31.01.1982 Abfluss: 106 m³/s
- 03.06.2013 Abfluss: 99 m³/s
| Date | Mean value [m³/s] | Maximum [m³/s] | Minimum [m³/s] |
|---|---|---|---|
| 13.05.2024 | 0.941 | 0.945 | 0.892 |
| 12.05.2024 | 0.966 | 1 | 0.945 |
| 11.05.2024 | 1.01 | 1.06 | 1 |
| 10.05.2024 | 1.16 | 1.26 | 1.06 |
| 09.05.2024 | 0.868 | 1.26 | 0.611 |
| 08.05.2024 | 0.773 | 0.945 | 0.643 |
| 07.05.2024 | 3.22 | 7.36 | 0.797 |
© Bayerisches Landesamt für Umwelt 2024