
- Start >
- Rivers >
- Discharge >
- Untere Donau >
- Unterkashof >
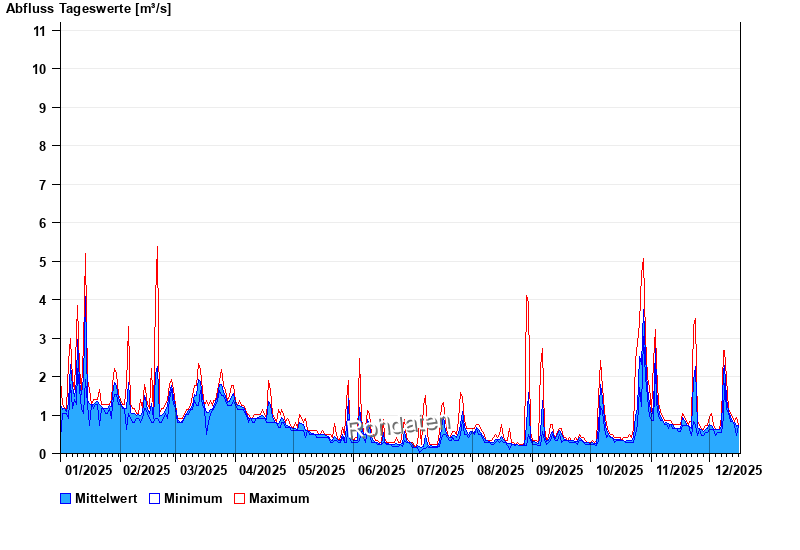
- Chart of year

Chart of year Unterkashof / Reschwasser
Discharge from 01.01.2025 to 16.12.2025
- HQ1 15 m³/s
- HQ2 19 m³/s
- HQ5 25 m³/s
- HQ10 31 m³/s
- HQ20 37 m³/s
- HQ50 47 m³/s
- HQ100 56 m³/s
| Date | Mean value [m³/s] | Maximum [m³/s] | Minimum [m³/s] |
|---|---|---|---|
| 16.12.2025 | 0.727 | 0.727 | 0.727 |
| 15.12.2025 | 0.711 | 0.935 | 0.469 |
| 14.12.2025 | 0.798 | 0.829 | 0.727 |
| 13.12.2025 | 0.837 | 0.935 | 0.829 |
| 12.12.2025 | 0.965 | 1.04 | 0.829 |
| 11.12.2025 | 1.1 | 1.17 | 1.04 |
| 10.12.2025 | 1.44 | 1.94 | 1.17 |
© Bayerisches Landesamt für Umwelt 2025