
- Start >
- Rivers >
- Discharge >
- Untere Donau >
- Triftern >
- Chart of year

Chart of year Triftern / Altbach
Discharge from 01.01.2024 to 01.05.2024
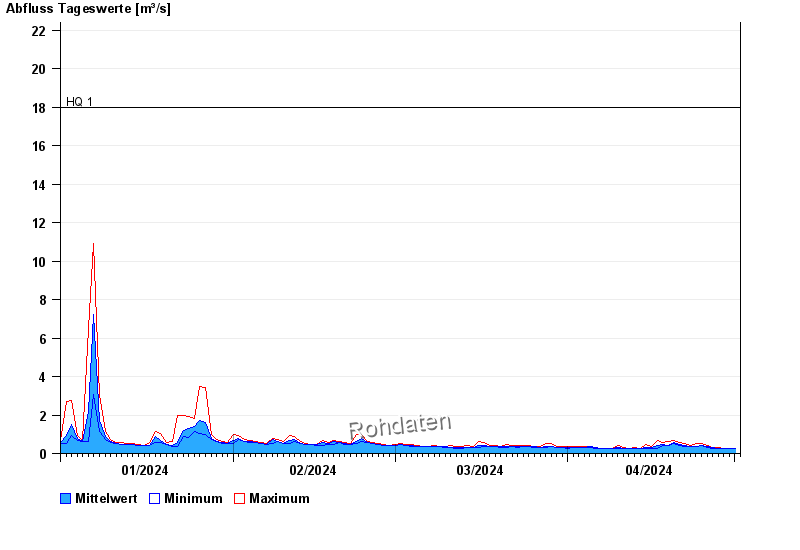
- HQ1 18 m³/s
- HQ2 23 m³/s
- HQ5 32 m³/s
- HQ10 39 m³/s
- HQ20 47 m³/s
- HQ50 60 m³/s
- HQ100 70 m³/s
| Date | Mean value [m³/s] | Maximum [m³/s] | Minimum [m³/s] |
|---|---|---|---|
| 01.05.2024 | 0.241 | 0.241 | 0.241 |
| 30.04.2024 | 0.269 | 0.277 | 0.241 |
| 29.04.2024 | 0.277 | 0.277 | 0.277 |
| 28.04.2024 | 0.282 | 0.317 | 0.277 |
| 27.04.2024 | 0.314 | 0.317 | 0.277 |
| 26.04.2024 | 0.352 | 0.401 | 0.317 |
| 25.04.2024 | 0.439 | 0.496 | 0.401 |
© Bayerisches Landesamt für Umwelt 2024