
- Start >
- Rivers >
- Discharge >
- Untere Donau >
- Staudach >
- Chart of year

Chart of year Staudach / Tiroler Achen
Discharge from 22.09.2019 to 21.09.2020
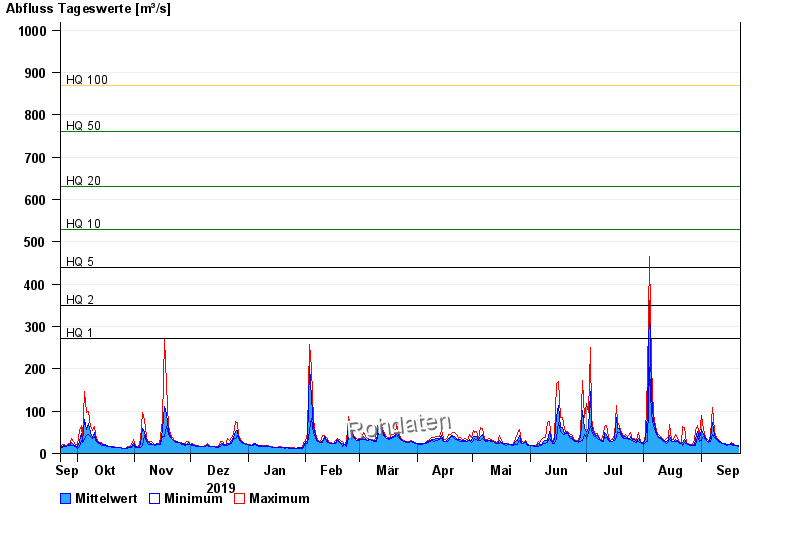
- HQ1 272 m³/s
- HQ2 350 m³/s
- HQ5 440 m³/s
- HQ10 530 m³/s
- HQ20 630 m³/s
- HQ50 760 m³/s
- HQ100 870 m³/s
| Date | Mean value [m³/s] | Maximum [m³/s] | Minimum [m³/s] |
|---|---|---|---|
| 21.09.2020 | 17.9 | 18.6 | 16.9 |
| 20.09.2020 | 18.4 | 18.6 | 18 |
| 19.09.2020 | 19.3 | 19.8 | 18.6 |
| 18.09.2020 | 21 | 22.8 | 19.8 |
| 17.09.2020 | 23.7 | 26.6 | 20.4 |
| 16.09.2020 | 20.7 | 21.6 | 20.4 |
| 15.09.2020 | 21.5 | 22.1 | 19.2 |
© Bayerisches Landesamt für Umwelt 2024