
- Start >
- Rivers >
- Discharge >
- Untere Donau >
- Staudach >
- Chart of year

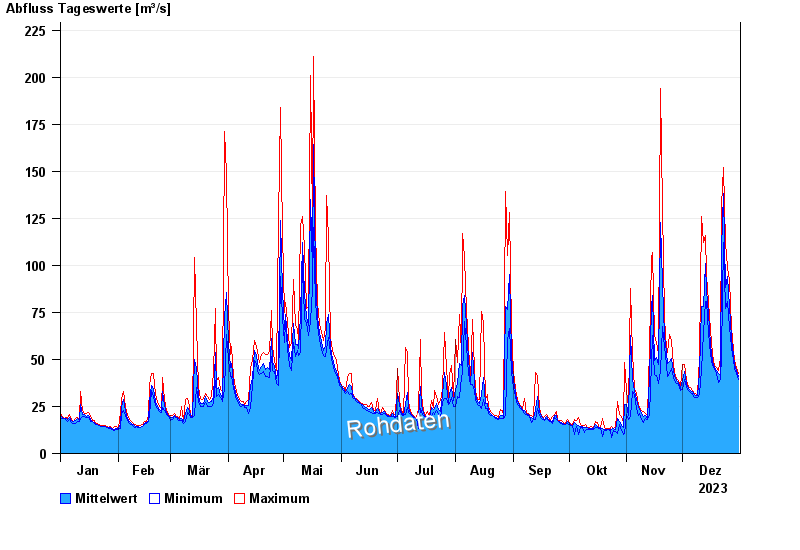
Chart of year Staudach / Tiroler Achen
Discharge from 01.01.2023 to 31.12.2023
| Date | Mean value [m³/s] | Maximum [m³/s] | Minimum [m³/s] |
|---|---|---|---|
| 31.12.2023 | 39.7 | 42.1 | 38.1 |
| 30.12.2023 | 42.6 | 43.7 | 41.3 |
| 29.12.2023 | 46.1 | 47.9 | 43.7 |
| 28.12.2023 | 50.7 | 53.9 | 47.9 |
| 27.12.2023 | 59.5 | 65.8 | 53.9 |
| 26.12.2023 | 76.8 | 91.9 | 65.8 |
| 25.12.2023 | 93 | 98.4 | 80.6 |
© Bayerisches Landesamt für Umwelt 2025