
- Start >
- Rivers >
- Discharge >
- Untere Donau >
- Simbach >
- Chart of year

Chart of year Simbach / Simbach
Discharge from 01.01.2024 to 04.05.2024
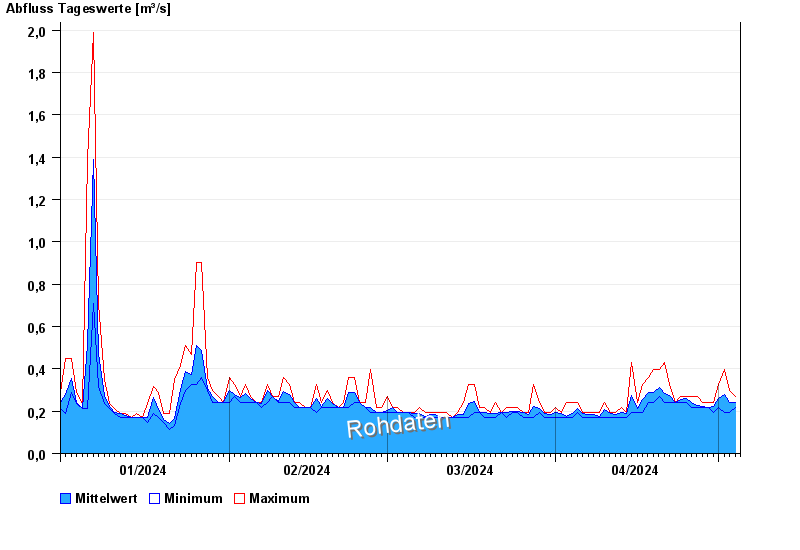
| Date | Mean value [m³/s] | Maximum [m³/s] | Minimum [m³/s] |
|---|---|---|---|
| 04.05.2024 | 0.269 | 0.269 | 0.269 |
| 03.05.2024 | 0.243 | 0.297 | 0.192 |
| 02.05.2024 | 0.278 | 0.395 | 0.192 |
| 01.05.2024 | 0.26 | 0.328 | 0.216 |
| 30.04.2024 | 0.22 | 0.241 | 0.192 |
| 29.04.2024 | 0.218 | 0.241 | 0.216 |
| 28.04.2024 | 0.221 | 0.241 | 0.216 |
© Bayerisches Landesamt für Umwelt 2024