
- Start >
- Rivers >
- Discharge >
- Untere Donau >
- Seebruck >
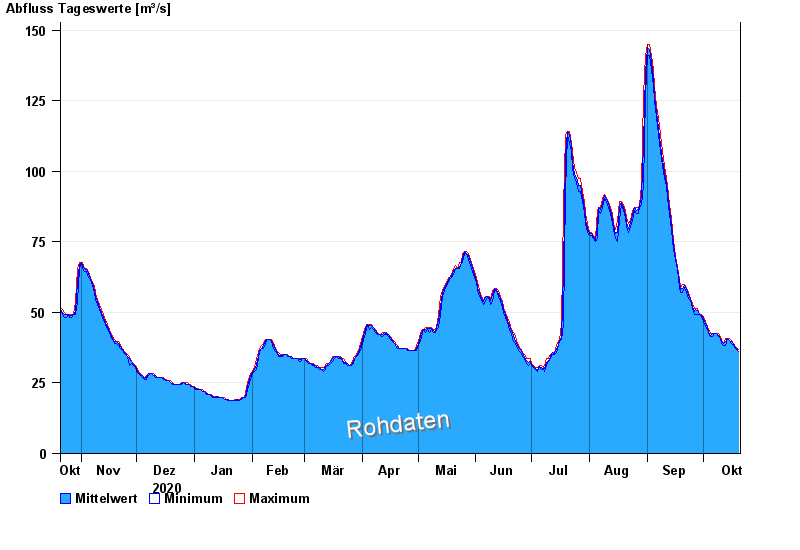
- Chart of year

Chart of year Seebruck / Alz
Discharge from 21.10.2020 to 20.10.2021
| Date | Mean value [m³/s] | Maximum [m³/s] | Minimum [m³/s] |
|---|---|---|---|
| 20.10.2021 | 36.2 | 36.8 | 36 |
| 19.10.2021 | 37.1 | 37.5 | 36.8 |
| 18.10.2021 | 38 | 38.3 | 37.5 |
| 17.10.2021 | 38.9 | 39.1 | 38.3 |
| 16.10.2021 | 39.7 | 39.9 | 39.1 |
| 15.10.2021 | 40.2 | 40.8 | 39.9 |
| 14.10.2021 | 40.8 | 40.8 | 40.8 |
© Bayerisches Landesamt für Umwelt 2024