
- Start >
- Rivers >
- Discharge >
- Untere Donau >
- Schönberg >
- Chart of year

Chart of year Schönberg / Große Ohe
Discharge from 26.05.2022 to 25.05.2023
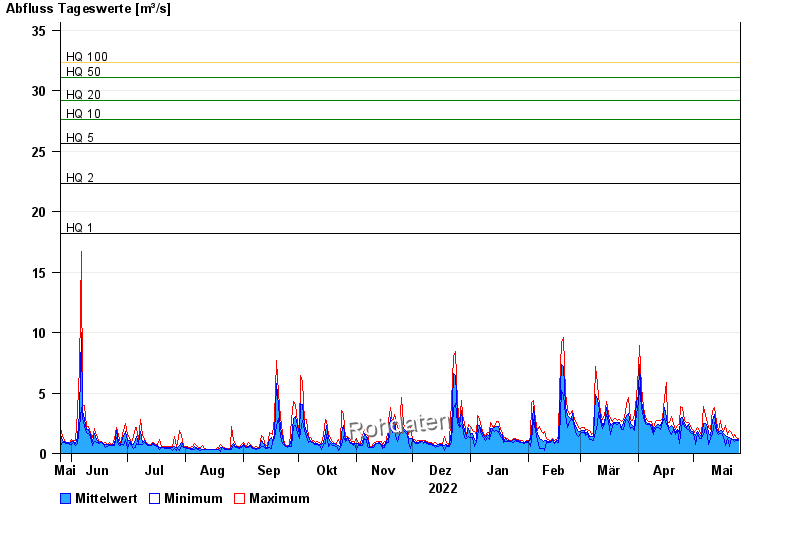
- HQ1 18,2 m³/s
- HQ2 22,3 m³/s
- HQ5 25,6 m³/s
- HQ10 27,6 m³/s
- HQ20 29,2 m³/s
- HQ50 31,1 m³/s
- HQ100 32,3 m³/s
| Date | Mean value [m³/s] | Maximum [m³/s] | Minimum [m³/s] |
|---|---|---|---|
| 25.05.2023 | 1.16 | 1.22 | 1.04 |
| 24.05.2023 | 1.17 | 1.35 | 1.1 |
| 23.05.2023 | 1.18 | 1.61 | 0.979 |
| 22.05.2023 | 1.18 | 1.35 | 1.1 |
| 21.05.2023 | 1.25 | 1.75 | 1.22 |
| 20.05.2023 | 1.31 | 1.9 | 0.547 |
| 19.05.2023 | 1.38 | 1.61 | 1.22 |
© Bayerisches Landesamt für Umwelt 2024