
- Start >
- Rivers >
- Discharge >
- Untere Donau >
- Schönberg >
- Chart of year

Chart of year Schönberg / Große Ohe
Discharge from 01.01.2020 to 31.12.2020
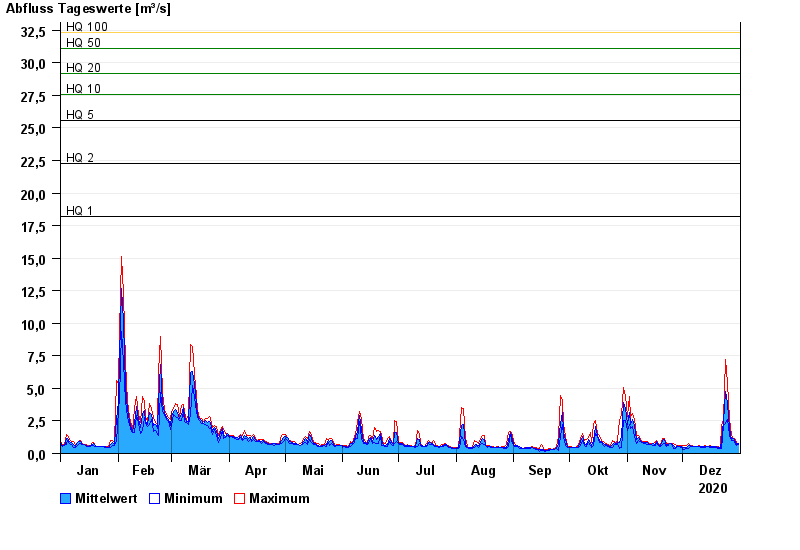
- HQ1 18,2 m³/s
- HQ2 22,3 m³/s
- HQ5 25,6 m³/s
- HQ10 27,6 m³/s
- HQ20 29,2 m³/s
- HQ50 31,1 m³/s
- HQ100 32,3 m³/s
| Date | Mean value [m³/s] | Maximum [m³/s] | Minimum [m³/s] |
|---|---|---|---|
| 31.12.2020 | 0.734 | 0.739 | 0.691 |
| 30.12.2020 | 0.729 | 0.84 | 0.647 |
| 29.12.2020 | 1.02 | 1.13 | 0.84 |
| 28.12.2020 | 1.12 | 1.19 | 1.01 |
| 27.12.2020 | 1.09 | 1.38 | 1.01 |
| 26.12.2020 | 1.93 | 2.58 | 1.38 |
| 25.12.2020 | 3.83 | 5.38 | 2.58 |
© Bayerisches Landesamt für Umwelt 2024