
- Start >
- Rivers >
- Discharge >
- Untere Donau >
- Salching >
- Chart of year

Chart of year Salching / Aiterach
Discharge from 10.08.2021 to 09.08.2022
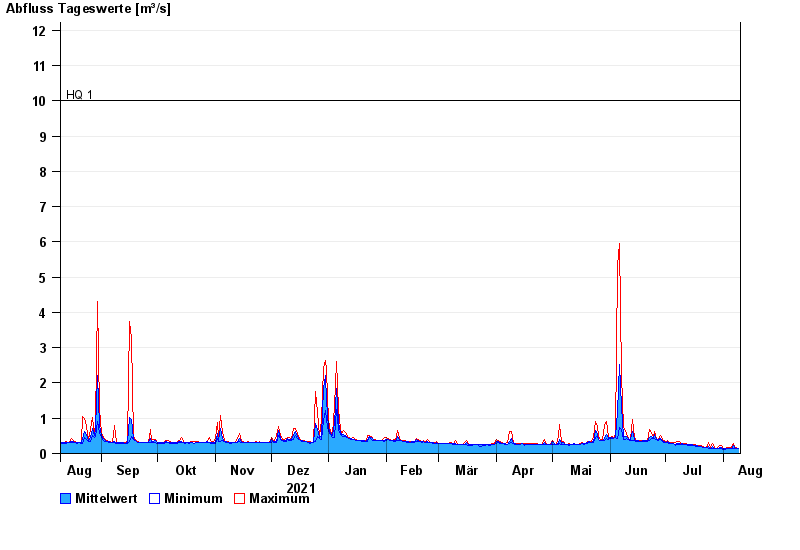
- HQ1 10 m³/s
- HQ2 16 m³/s
- HQ5 23 m³/s
- HQ10 28 m³/s
- HQ20 33 m³/s
- HQ50 40 m³/s
- HQ100 45 m³/s
| Date | Mean value [m³/s] | Maximum [m³/s] | Minimum [m³/s] |
|---|---|---|---|
| 09.08.2022 | 0.138 | 0.151 | 0.128 |
| 08.08.2022 | 0.145 | 0.165 | 0.138 |
| 07.08.2022 | 0.165 | 0.199 | 0.148 |
| 06.08.2022 | 0.225 | 0.283 | 0.145 |
| 05.08.2022 | 0.15 | 0.161 | 0.143 |
| 04.08.2022 | 0.151 | 0.159 | 0.142 |
| 03.08.2022 | 0.148 | 0.157 | 0.14 |
© Bayerisches Landesamt für Umwelt 2024