
- Start >
- Rivers >
- Discharge >
- Untere Donau >
- Salching >
- Chart of year

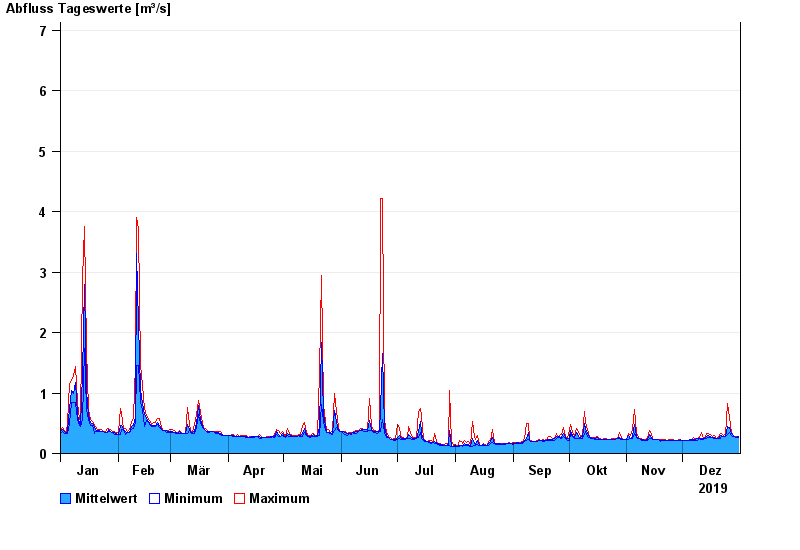
Chart of year Salching / Aiterach
Discharge from 01.01.2019 to 31.12.2019
- 13.01.2011 Abfluss: 34,4 m³/s
- 13.04.1994 Abfluss: 31,3 m³/s
- 16.02.2006 Abfluss: 30,2 m³/s
- 03.03.1987 Abfluss: 28,7 m³/s
- 01.02.1985 Abfluss: 28,4 m³/s
| Date | Mean value [m³/s] | Maximum [m³/s] | Minimum [m³/s] |
|---|---|---|---|
| 31.12.2019 | 0.273 | 0.283 | 0.262 |
| 30.12.2019 | 0.271 | 0.282 | 0.261 |
| 29.12.2019 | 0.281 | 0.281 | 0.28 |
| 28.12.2019 | 0.293 | 0.301 | 0.28 |
| 27.12.2019 | 0.327 | 0.345 | 0.3 |
| 26.12.2019 | 0.434 | 0.6 | 0.344 |
| 25.12.2019 | 0.453 | 0.827 | 0.319 |
© Bayerisches Landesamt für Umwelt 2024