
- Start >
- Rivers >
- Discharge >
- Untere Donau >
- Salching >
- Chart of year

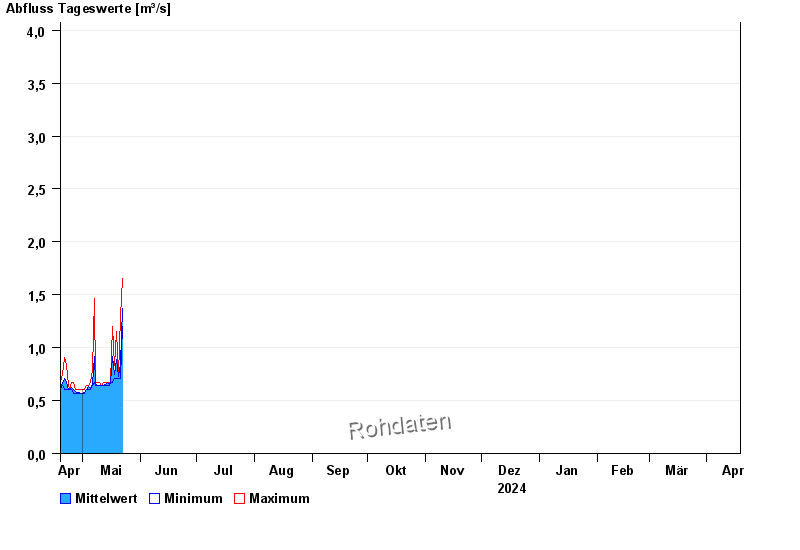
Chart of year Salching / Aiterach
Discharge from 19.04.2024 to 18.04.2025
- HQ1 10 m³/s
- HQ2 16 m³/s
- HQ5 23 m³/s
- HQ10 28 m³/s
- HQ20 33 m³/s
- HQ50 40 m³/s
- HQ100 45 m³/s
| Date | Mean value [m³/s] | Maximum [m³/s] | Minimum [m³/s] |
|---|---|---|---|
| 01.05.2024 | 0.566 | 0.566 | 0.566 |
| 30.04.2024 | 0.569 | 0.602 | 0.566 |
| 29.04.2024 | 0.572 | 0.602 | 0.566 |
| 28.04.2024 | 0.574 | 0.602 | 0.566 |
| 27.04.2024 | 0.589 | 0.602 | 0.566 |
| 26.04.2024 | 0.608 | 0.675 | 0.566 |
| 25.04.2024 | 0.623 | 0.675 | 0.602 |
© Bayerisches Landesamt für Umwelt 2024