
- Start >
- Rivers >
- Discharge >
- Untere Donau >
- Salching >
- Chart of year

Chart of year Salching / Aiterach
Discharge from 01.01.2023 to 31.12.2023
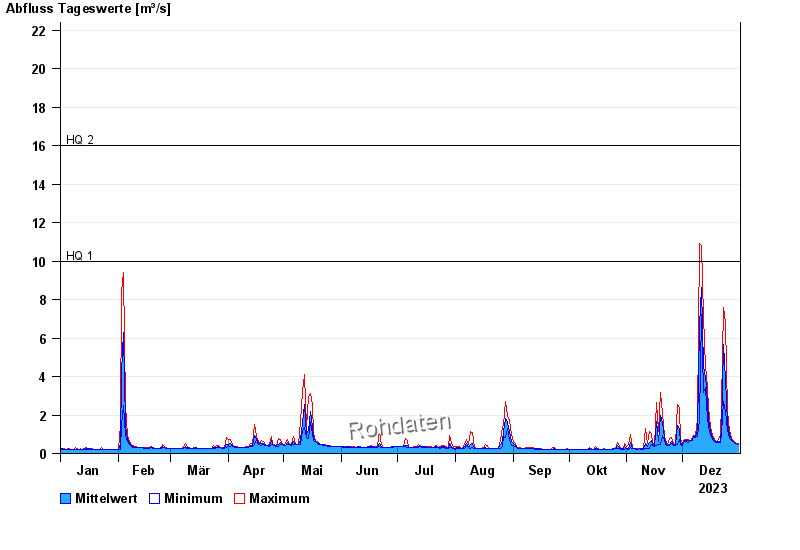
- HQ1 10 m³/s
- HQ2 16 m³/s
- HQ5 23 m³/s
- HQ10 28 m³/s
- HQ20 33 m³/s
- HQ50 40 m³/s
- HQ100 45 m³/s
| Date | Mean value [m³/s] | Maximum [m³/s] | Minimum [m³/s] |
|---|---|---|---|
| 31.12.2023 | 0.488 | 0.533 | 0.467 |
| 30.12.2023 | 0.51 | 0.533 | 0.5 |
| 29.12.2023 | 0.557 | 0.602 | 0.533 |
| 28.12.2023 | 0.622 | 0.675 | 0.602 |
| 27.12.2023 | 0.722 | 0.789 | 0.675 |
| 26.12.2023 | 0.966 | 1.19 | 0.789 |
| 25.12.2023 | 1.58 | 2.17 | 1.19 |
© Bayerisches Landesamt für Umwelt 2024