
- Start >
- Rivers >
- Discharge >
- Untere Donau >
- Salching >
- Chart of total period

Chart of total period Salching / Aiterach
Discharge from 01.11.1980 to 27.04.2024
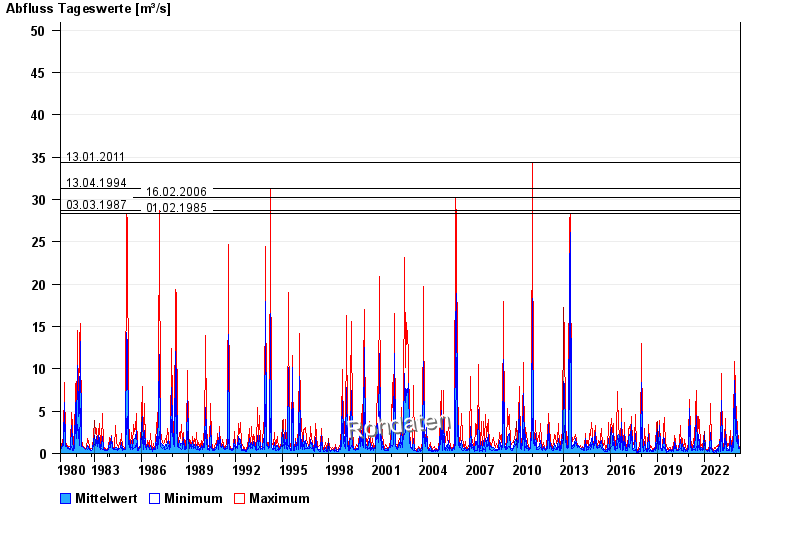
- 13.01.2011 Abfluss: 34,4 m³/s
- 13.04.1994 Abfluss: 31,3 m³/s
- 16.02.2006 Abfluss: 30,2 m³/s
- 03.03.1987 Abfluss: 28,7 m³/s
- 01.02.1985 Abfluss: 28,4 m³/s
| Date | Mean value [m³/s] | Maximum [m³/s] | Minimum [m³/s] |
|---|---|---|---|
| 27.04.2024 | 0.602 | 0.602 | 0.602 |
| 26.04.2024 | 0.608 | 0.675 | 0.566 |
| 25.04.2024 | 0.623 | 0.675 | 0.602 |
| 24.04.2024 | 0.602 | 0.602 | 0.602 |
| 23.04.2024 | 0.608 | 0.638 | 0.602 |
| 22.04.2024 | 0.667 | 0.83 | 0.602 |
| 21.04.2024 | 0.706 | 0.905 | 0.602 |
© Bayerisches Landesamt für Umwelt 2024