
- Start >
- Rivers >
- Discharge >
- Untere Donau >
- Ruhstorf >
- Chart of year

Chart of year Ruhstorf / Rott
Discharge from 28.09.2020 to 27.09.2021
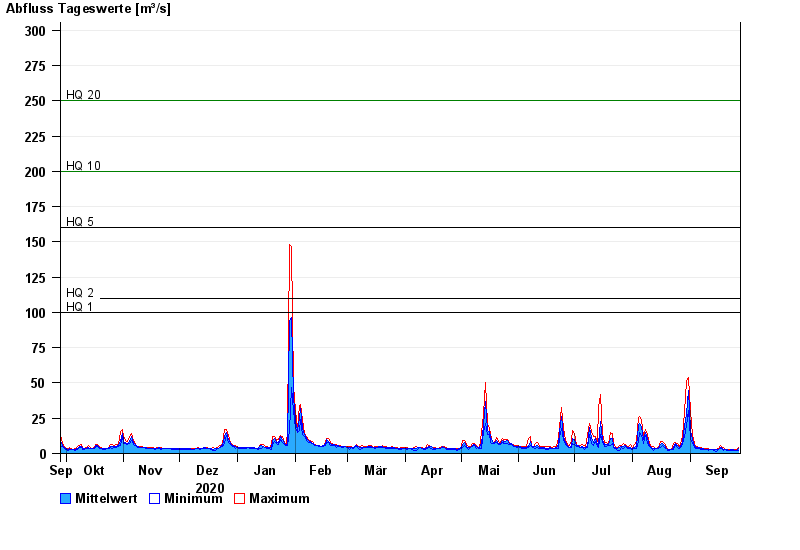
- HQ1 100 m³/s
- HQ2 110 m³/s
- HQ5 160 m³/s
- HQ10 200 m³/s
- HQ20 250 m³/s
- HQ50 337 m³/s
- HQ100 480 m³/s
| Date | Mean value [m³/s] | Maximum [m³/s] | Minimum [m³/s] |
|---|---|---|---|
| 27.09.2021 | 3.25 | 4.04 | 2.19 |
| 26.09.2021 | 2.35 | 3.01 | 1.88 |
| 25.09.2021 | 2.48 | 2.8 | 1.88 |
| 24.09.2021 | 2.52 | 2.73 | 2.22 |
| 23.09.2021 | 2.5 | 2.67 | 2.33 |
| 22.09.2021 | 2.47 | 3.13 | 1.85 |
| 21.09.2021 | 2.72 | 2.83 | 2.3 |
© Bayerisches Landesamt für Umwelt 2024