
- Start >
- Rivers >
- Discharge >
- Untere Donau >
- Ruhstorf >
- Chart of year

Chart of year Ruhstorf / Rott
Discharge from 25.01.2022 to 24.01.2023
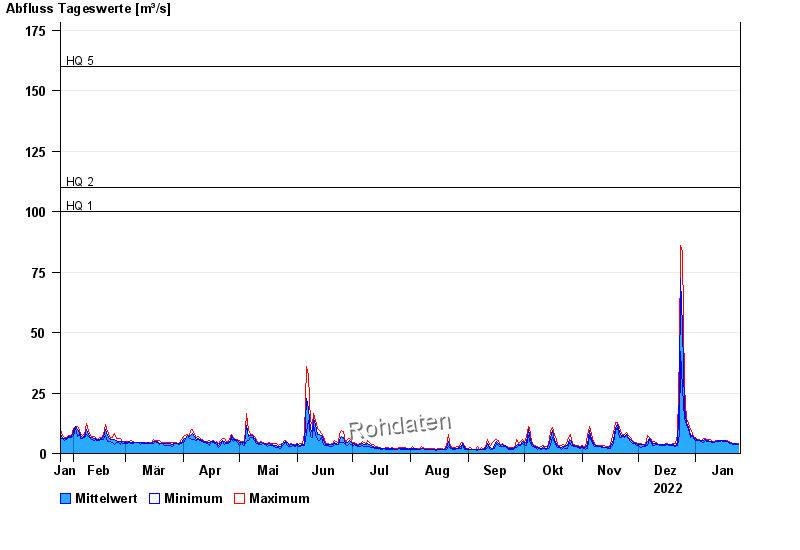
- HQ1 100 m³/s
- HQ2 110 m³/s
- HQ5 160 m³/s
- HQ10 200 m³/s
- HQ20 250 m³/s
- HQ50 337 m³/s
- HQ100 480 m³/s
| Date | Mean value [m³/s] | Maximum [m³/s] | Minimum [m³/s] |
|---|---|---|---|
| 24.01.2023 | 3.91 | 4.14 | 3.52 |
| 23.01.2023 | 3.94 | 4.14 | 3.72 |
| 22.01.2023 | 3.98 | 4.14 | 3.72 |
| 21.01.2023 | 4.04 | 4.14 | 3.72 |
| 20.01.2023 | 4.19 | 4.57 | 3.93 |
| 19.01.2023 | 4.59 | 5.02 | 3.93 |
| 18.01.2023 | 5.06 | 5.25 | 4.79 |
© Bayerisches Landesamt für Umwelt 2024