
- Start >
- Rivers >
- Discharge >
- Untere Donau >
- Ruhstorf >
- Chart of year

Chart of year Ruhstorf / Rott
Discharge from 25.01.2020 to 24.01.2021
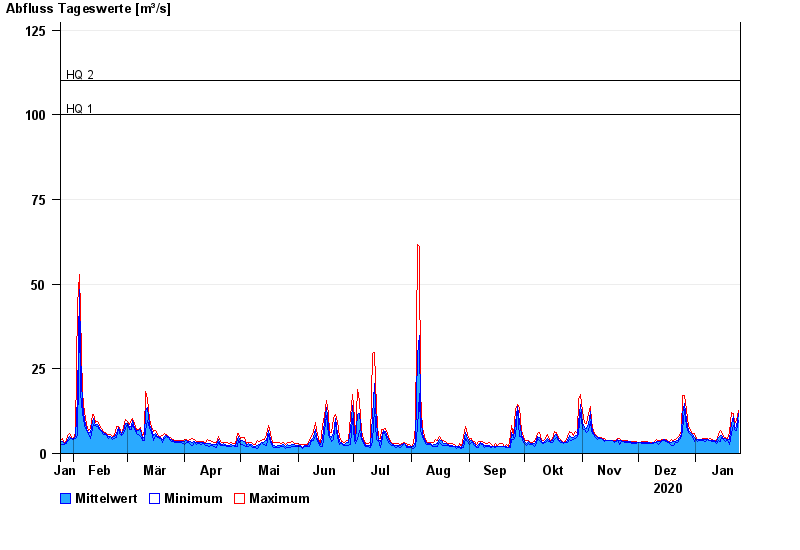
- HQ1 100 m³/s
- HQ2 110 m³/s
- HQ5 160 m³/s
- HQ10 200 m³/s
- HQ20 250 m³/s
- HQ50 337 m³/s
- HQ100 480 m³/s
| Date | Mean value [m³/s] | Maximum [m³/s] | Minimum [m³/s] |
|---|---|---|---|
| 24.01.2021 | 11.9 | 12.7 | 9.72 |
| 23.01.2021 | 7.98 | 9.72 | 6.72 |
| 22.01.2021 | 7.49 | 8.86 | 6.97 |
| 21.01.2021 | 10.9 | 11.8 | 8.31 |
| 20.01.2021 | 9 | 12.1 | 5.78 |
| 19.01.2021 | 4.15 | 6.29 | 2.68 |
| 18.01.2021 | 4.21 | 4.53 | 3.86 |
© Bayerisches Landesamt für Umwelt 2024