
- Start >
- Rivers >
- Discharge >
- Untere Donau >
- Ruhstorf >
- Chart of year

Chart of year Ruhstorf / Rott
Discharge from 23.09.2019 to 22.09.2020
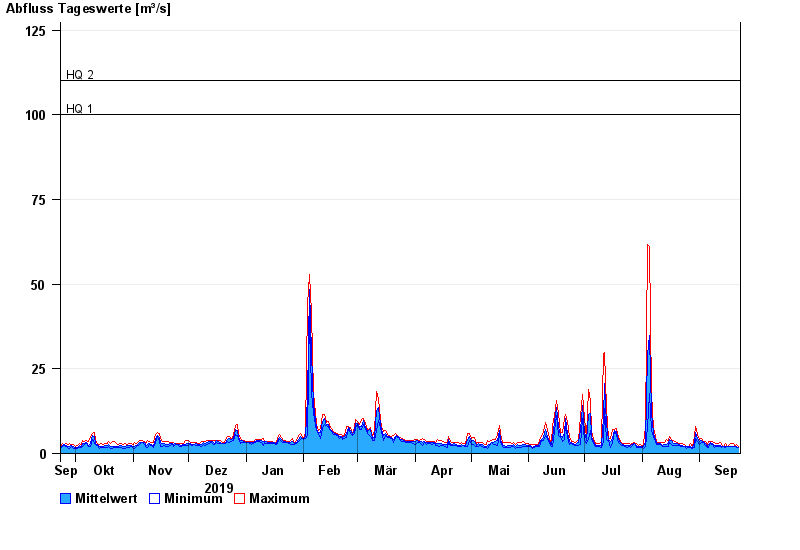
- HQ1 100 m³/s
- HQ2 110 m³/s
- HQ5 160 m³/s
- HQ10 200 m³/s
- HQ20 250 m³/s
- HQ50 337 m³/s
- HQ100 480 m³/s
| Date | Mean value [m³/s] | Maximum [m³/s] | Minimum [m³/s] |
|---|---|---|---|
| 22.09.2020 | 1.89 | 2.05 | 1.76 |
| 21.09.2020 | 2.07 | 2.67 | 1.8 |
| 20.09.2020 | 2.06 | 2.21 | 1.94 |
| 19.09.2020 | 2.1 | 3.02 | 1.93 |
| 18.09.2020 | 2.17 | 2.83 | 1.93 |
| 17.09.2020 | 2.15 | 2.66 | 2.06 |
| 16.09.2020 | 2.08 | 2.19 | 1.92 |
© Bayerisches Landesamt für Umwelt 2024