
- Start >
- Rivers >
- Discharge >
- Untere Donau >
- Ruhstorf >
- Chart of year

Chart of year Ruhstorf / Rott
Discharge from 01.08.2021 to 31.07.2022
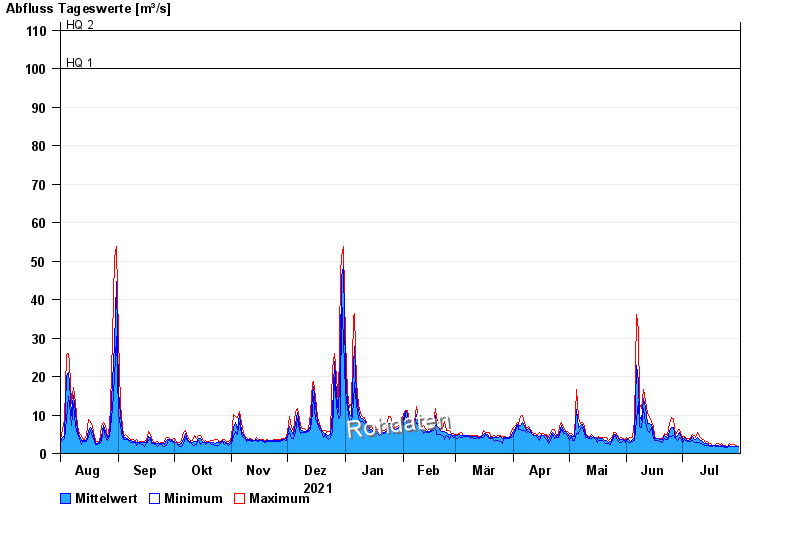
- HQ1 100 m³/s
- HQ2 110 m³/s
- HQ5 160 m³/s
- HQ10 200 m³/s
- HQ20 250 m³/s
- HQ50 337 m³/s
- HQ100 480 m³/s
| Date | Mean value [m³/s] | Maximum [m³/s] | Minimum [m³/s] |
|---|---|---|---|
| 31.07.2022 | 1.84 | 1.87 | 1.74 |
| 30.07.2022 | 1.89 | 1.99 | 1.74 |
| 29.07.2022 | 1.9 | 2.42 | 1.74 |
| 28.07.2022 | 1.92 | 2.42 | 1.74 |
| 27.07.2022 | 1.93 | 2.42 | 1.74 |
| 26.07.2022 | 2.19 | 2.57 | 1.87 |
| 25.07.2022 | 1.77 | 1.87 | 1.63 |
© Bayerisches Landesamt für Umwelt 2024