
- Start >
- Rivers >
- Discharge >
- Untere Donau >
- Ruhstorf >
- Chart of year

Chart of year Ruhstorf / Rott
Discharge from 01.01.2023 to 31.12.2023
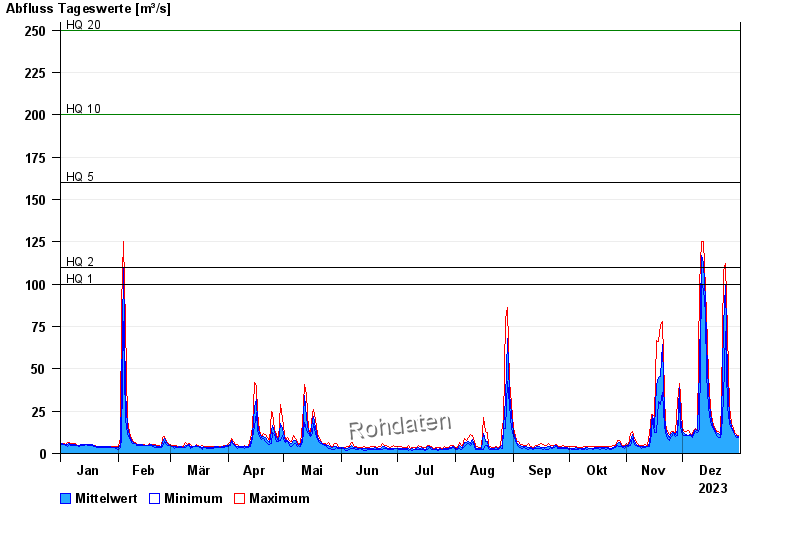
- HQ1 100 m³/s
- HQ2 110 m³/s
- HQ5 160 m³/s
- HQ10 200 m³/s
- HQ20 250 m³/s
- HQ50 337 m³/s
- HQ100 480 m³/s
| Date | Mean value [m³/s] | Maximum [m³/s] | Minimum [m³/s] |
|---|---|---|---|
| 31.12.2023 | 10 | 10.6 | 9.72 |
| 30.12.2023 | 10.5 | 11.2 | 9.72 |
| 29.12.2023 | 11.5 | 12.2 | 11.2 |
| 28.12.2023 | 13.2 | 14.7 | 12.2 |
| 27.12.2023 | 15.9 | 17.7 | 14.7 |
| 26.12.2023 | 21.5 | 27.9 | 17.7 |
| 25.12.2023 | 45.1 | 71.5 | 27.9 |
© Bayerisches Landesamt für Umwelt 2024