
- Start >
- Rivers >
- Discharge >
- Untere Donau >
- Röhrnbach >
- Chart of year

Chart of year Röhrnbach / Osterbach
Discharge from 01.01.2024 to 26.04.2024
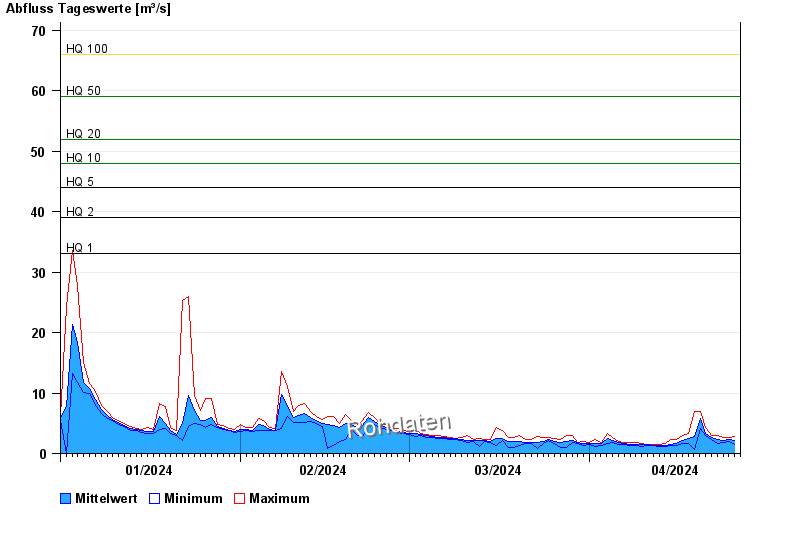
- HQ1 33 m³/s
- HQ2 39 m³/s
- HQ5 44 m³/s
- HQ10 48 m³/s
- HQ20 52 m³/s
- HQ50 59 m³/s
- HQ100 66 m³/s
| Date | Mean value [m³/s] | Maximum [m³/s] | Minimum [m³/s] |
|---|---|---|---|
| 26.04.2024 | 2.27 | 2.36 | 2.15 |
| 25.04.2024 | 2.35 | 2.68 | 2.05 |
| 24.04.2024 | 2.2 | 2.68 | 1.85 |
| 23.04.2024 | 2.33 | 3.02 | 1.59 |
| 22.04.2024 | 2.62 | 2.91 | 2.36 |
| 21.04.2024 | 3.35 | 4.23 | 2.91 |
| 20.04.2024 | 5.8 | 7.01 | 4.1 |
© Bayerisches Landesamt für Umwelt 2024