
- Start >
- Rivers >
- Discharge >
- Untere Donau >
- Postmünster >
- Chart of year

Chart of year Postmünster / Gambach
Discharge from 27.05.2020 to 26.05.2021
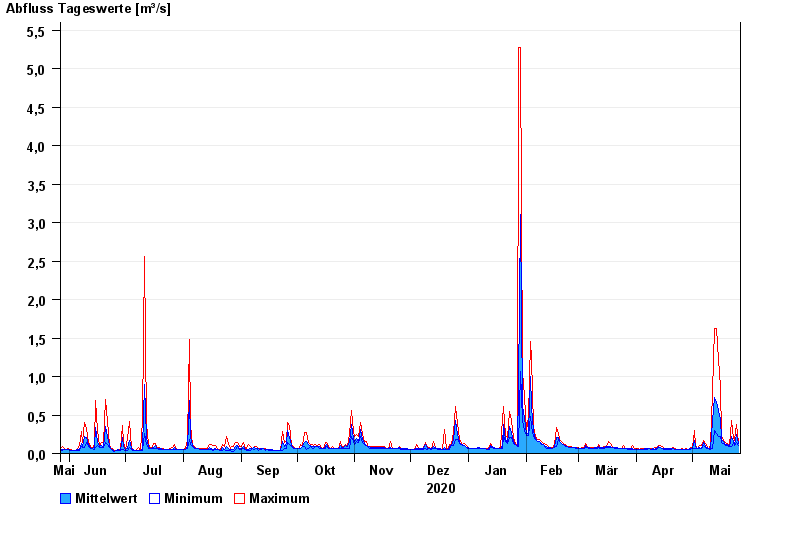
| Date | Mean value [m³/s] | Maximum [m³/s] | Minimum [m³/s] |
|---|---|---|---|
| 26.05.2021 | 0.124 | 0.148 | 0.108 |
| 25.05.2021 | 0.245 | 0.376 | 0.148 |
| 24.05.2021 | 0.119 | 0.172 | 0.108 |
| 23.05.2021 | 0.153 | 0.198 | 0.127 |
| 22.05.2021 | 0.218 | 0.423 | 0.092 |
| 21.05.2021 | 0.093 | 0.108 | 0.092 |
| 20.05.2021 | 0.112 | 0.127 | 0.108 |
© Bayerisches Landesamt für Umwelt 2024