
- Start >
- Rivers >
- Discharge >
- Untere Donau >
- Postmünster >
- Chart of year

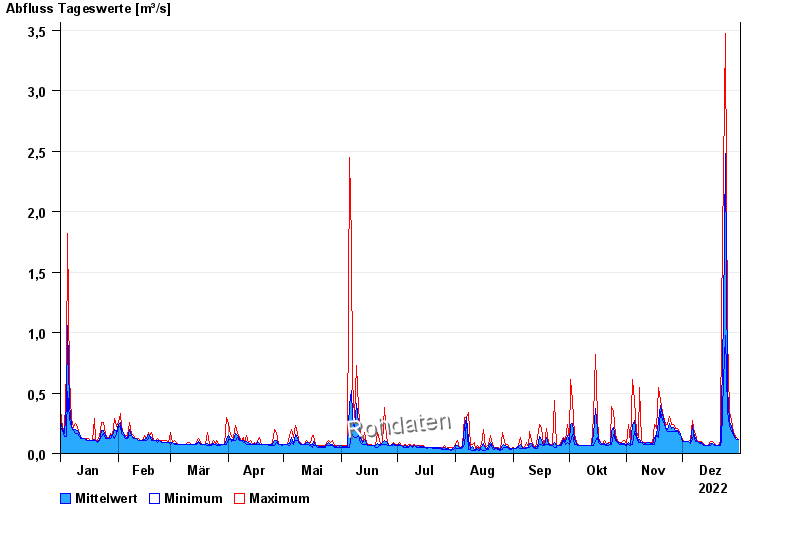
Chart of year Postmünster / Gambach
Discharge from 01.01.2022 to 31.12.2022
| Date | Mean value [m³/s] | Maximum [m³/s] | Minimum [m³/s] |
|---|---|---|---|
| 31.12.2022 | 0.113 | 0.113 | 0.113 |
| 30.12.2022 | 0.115 | 0.133 | 0.113 |
| 29.12.2022 | 0.139 | 0.155 | 0.133 |
| 28.12.2022 | 0.165 | 0.179 | 0.155 |
| 27.12.2022 | 0.226 | 0.269 | 0.179 |
| 26.12.2022 | 0.266 | 0.345 | 0.235 |
| 25.12.2022 | 0.537 | 0.975 | 0.345 |
© Bayerisches Landesamt für Umwelt 2024