
- Start >
- Rivers >
- Discharge >
- Untere Donau >
- Postmünster >
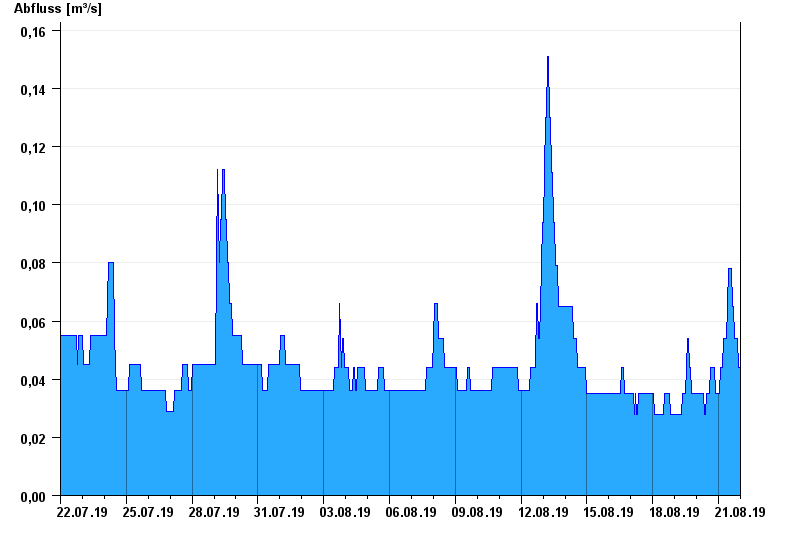
- Chart of month

Chart of month Postmünster / Gambach
Discharge from 22.07.2019 to 21.08.2019
- 02.08.1991 Abfluss: 18,2 m³/s
- 12.06.1990 Abfluss: 16,9 m³/s
- 13.01.2004 Abfluss: 15,8 m³/s
- 01.08.1991 Abfluss: 13,4 m³/s
- 02.06.1995 Abfluss: 13,1 m³/s
| Date | Runoff [m³/s] |
|---|---|
| 22.08.2019 00:45 | 0.044 |
| 22.08.2019 00:30 | 0.044 |
| 22.08.2019 00:15 | 0.044 |
| 22.08.2019 00:00 | 0.044 |
| 21.08.2019 23:45 | 0.044 |
| 21.08.2019 23:30 | 0.044 |
| 21.08.2019 23:15 | 0.044 |
© Bayerisches Landesamt für Umwelt 2024