
- Start >
- Rivers >
- Discharge >
- Untere Donau >
- Pfelling >
- Chart of year

Chart of year Pfelling / Donau
Discharge from 01.01.2024 to 31.12.2024
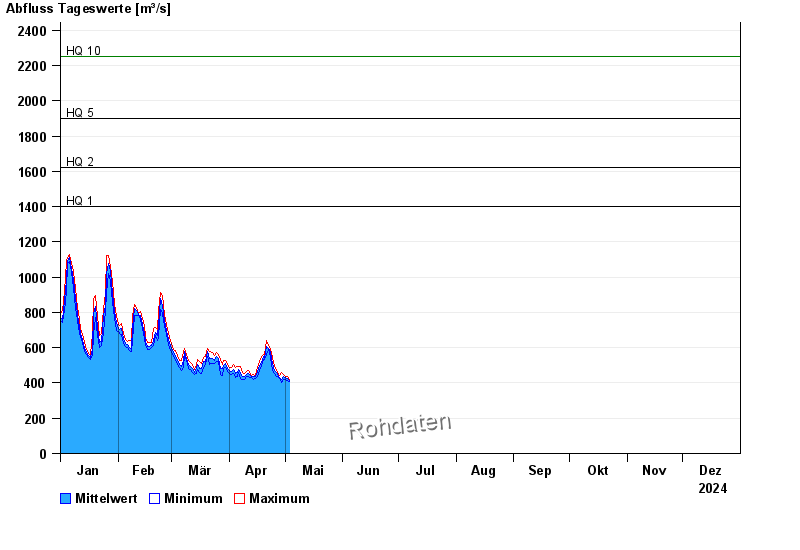
- HQ1 1400 m³/s
- HQ2 1620 m³/s
- HQ5 1900 m³/s
- HQ10 2250 m³/s
- HQ20 2600 m³/s
- HQ50 3050 m³/s
- HQ100 3400 m³/s
| Date | Mean value [m³/s] | Maximum [m³/s] | Minimum [m³/s] |
|---|---|---|---|
| 11.05.2024 | 443 | 481 | 417 |
| 10.05.2024 | 500 | 534 | 478 |
| 09.05.2024 | 500 | 531 | 447 |
| 08.05.2024 | 432 | 468 | 412 |
| 07.05.2024 | 398 | 422 | 375 |
| 06.05.2024 | 381 | 390 | 375 |
| 05.05.2024 | 393 | 427 | 375 |
© Bayerisches Landesamt für Umwelt 2024