
- Start >
- Rivers >
- Discharge >
- Untere Donau >
- Pfelling >
- Chart of year

Chart of year Pfelling / Donau
Discharge from 01.01.2020 to 31.12.2020
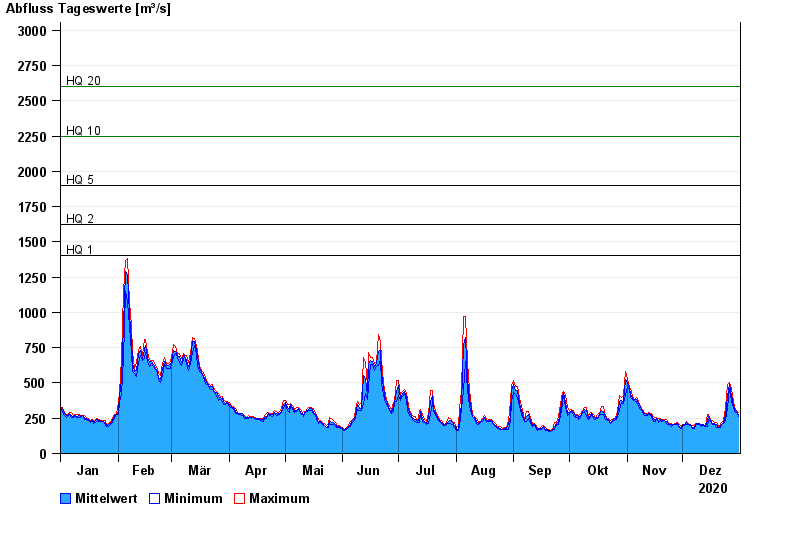
- HQ1 1400 m³/s
- HQ2 1620 m³/s
- HQ5 1900 m³/s
- HQ10 2250 m³/s
- HQ20 2600 m³/s
- HQ50 3050 m³/s
- HQ100 3400 m³/s
| Date | Mean value [m³/s] | Maximum [m³/s] | Minimum [m³/s] |
|---|---|---|---|
| 31.12.2020 | 275 | 293 | 259 |
| 30.12.2020 | 297 | 305 | 289 |
| 29.12.2020 | 310 | 326 | 297 |
| 28.12.2020 | 341 | 367 | 324 |
| 27.12.2020 | 408 | 460 | 367 |
| 26.12.2020 | 492 | 503 | 460 |
| 25.12.2020 | 403 | 490 | 322 |
© Bayerisches Landesamt für Umwelt 2024