
- Start >
- Rivers >
- Discharge >
- Untere Donau >
- Operding >
- Chart of year

Chart of year Operding / Hammerbach
Discharge from 29.11.2022 to 28.11.2023
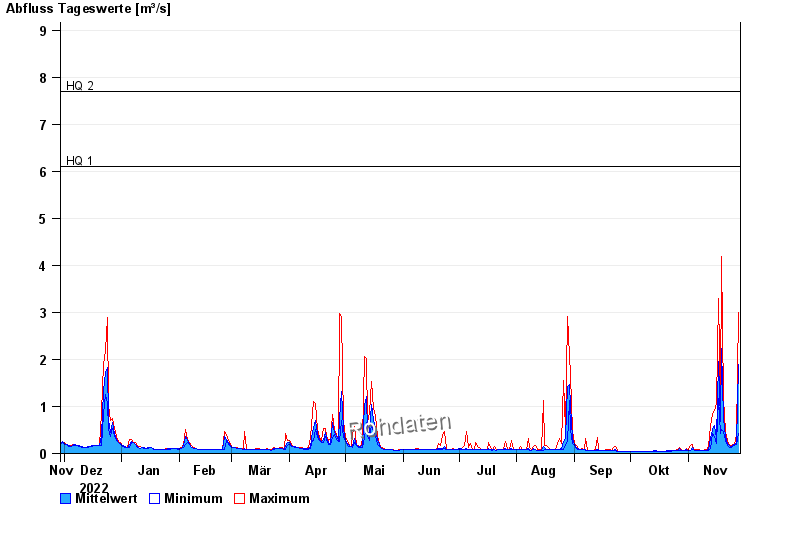
- HQ1 6,1 m³/s
- HQ2 7,7 m³/s
- HQ5 9,6 m³/s
- HQ10 11 m³/s
- HQ20 13 m³/s
- HQ50 16 m³/s
- HQ100 19 m³/s
| Date | Mean value [m³/s] | Maximum [m³/s] | Minimum [m³/s] |
|---|---|---|---|
| 28.11.2023 | 1.9 | 2.99 | 0.431 |
| 27.11.2023 | 0.215 | 0.397 | 0.2 |
| 26.11.2023 | 0.194 | 0.2 | 0.178 |
| 25.11.2023 | 0.198 | 0.2 | 0.178 |
| 24.11.2023 | 0.153 | 0.178 | 0.138 |
| 23.11.2023 | 0.16 | 0.178 | 0.138 |
| 22.11.2023 | 0.217 | 0.275 | 0.178 |
© Bayerisches Landesamt für Umwelt 2024