
- Start >
- Rivers >
- Discharge >
- Untere Donau >
- Operding >
- Chart of year

Chart of year Operding / Hammerbach
Discharge from 29.03.2024 to 28.03.2025
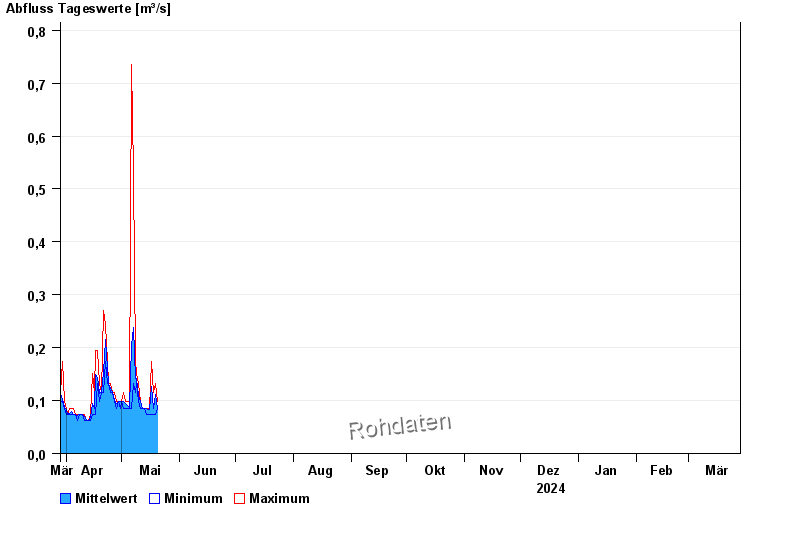
| Date | Mean value [m³/s] | Maximum [m³/s] | Minimum [m³/s] |
|---|---|---|---|
| 20.05.2024 | 0.086 | 0.099 | 0.085 |
| 19.05.2024 | 0.112 | 0.132 | 0.073 |
| 18.05.2024 | 0.085 | 0.115 | 0.073 |
| 17.05.2024 | 0.126 | 0.173 | 0.073 |
| 16.05.2024 | 0.084 | 0.085 | 0.073 |
| 15.05.2024 | 0.083 | 0.085 | 0.073 |
| 14.05.2024 | 0.085 | 0.085 | 0.073 |
© Bayerisches Landesamt für Umwelt 2024