
- Start >
- Rivers >
- Discharge >
- Untere Donau >
- Operding >
- Chart of year

Chart of year Operding / Hammerbach
Discharge from 29.03.2024 to 28.03.2025
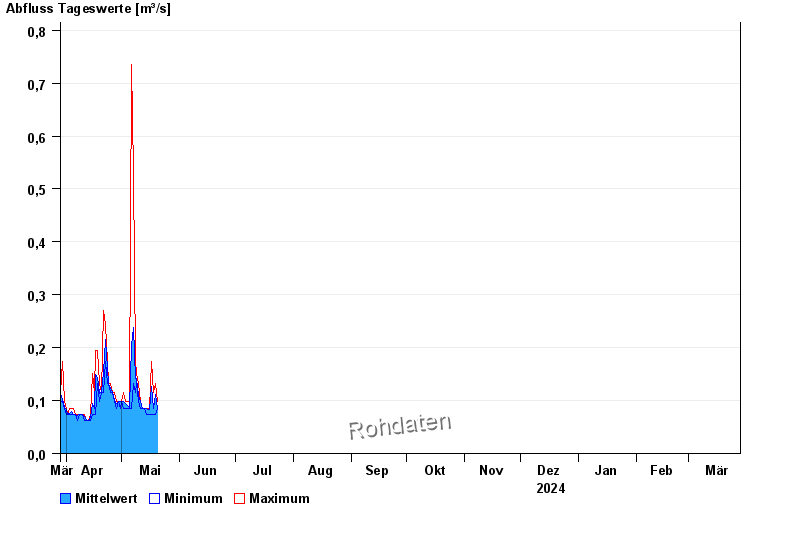
| Date | Mean value [m³/s] | Maximum [m³/s] | Minimum [m³/s] |
|---|---|---|---|
| 10.05.2024 | 0.117 | 0.132 | 0.115 |
| 09.05.2024 | 0.142 | 0.152 | 0.132 |
| 08.05.2024 | 0.141 | 0.173 | 0.115 |
| 07.05.2024 | 0.238 | 0.532 | 0.132 |
| 06.05.2024 | 0.204 | 0.735 | 0.085 |
| 05.05.2024 | 0.087 | 0.099 | 0.085 |
| 04.05.2024 | 0.091 | 0.099 | 0.085 |
© Bayerisches Landesamt für Umwelt 2024