
- Start >
- Rivers >
- Discharge >
- Untere Donau >
- Ösbühl >
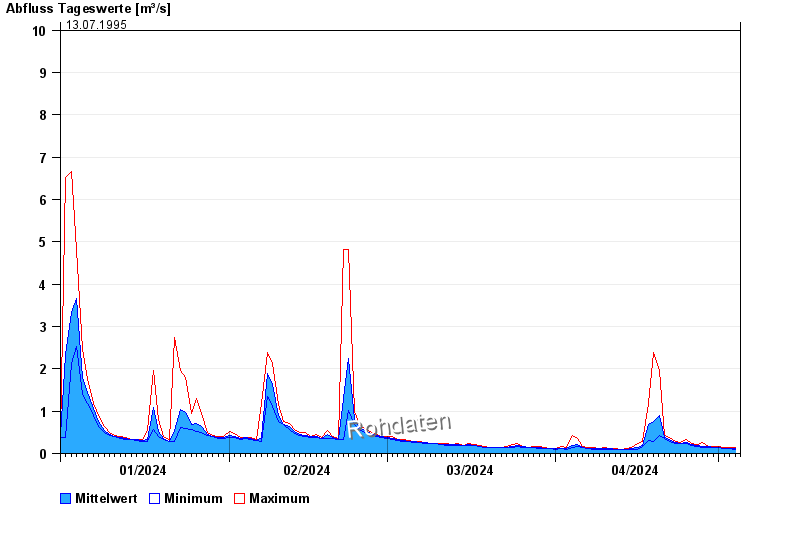
- Chart of year

Chart of year Ösbühl / Danglesbach
Discharge from 01.01.2024 to 04.05.2024
- 21.12.1993 Abfluss: 12,5 m³/s
- 01.11.1998 Abfluss: 12 m³/s
- 26.01.1995 Abfluss: 12 m³/s
- 26.02.1997 Abfluss: 10,9 m³/s
- 13.07.1995 Abfluss: 10 m³/s
| Date | Mean value [m³/s] | Maximum [m³/s] | Minimum [m³/s] |
|---|---|---|---|
| 04.05.2024 | 0.118 | 0.118 | 0.118 |
| 03.05.2024 | 0.127 | 0.131 | 0.118 |
| 02.05.2024 | 0.128 | 0.144 | 0.118 |
| 01.05.2024 | 0.136 | 0.157 | 0.131 |
| 30.04.2024 | 0.142 | 0.157 | 0.131 |
| 29.04.2024 | 0.156 | 0.17 | 0.144 |
| 28.04.2024 | 0.175 | 0.259 | 0.144 |
© Bayerisches Landesamt für Umwelt 2024