
- Start >
- Rivers >
- Discharge >
- Untere Donau >
- Oberndorf >
- Chart of year

Chart of year Oberndorf / Donau
Discharge from 01.01.2024 to 29.04.2024
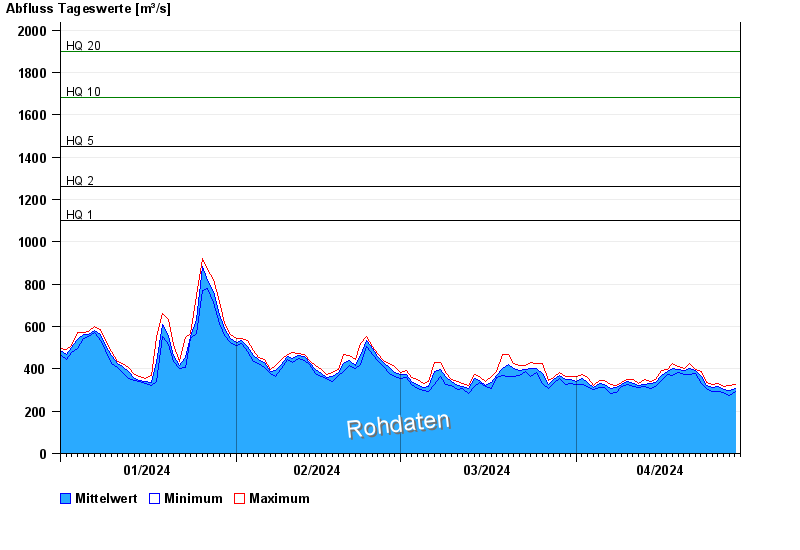
- HQ1 1100 m³/s
- HQ2 1260 m³/s
- HQ5 1450 m³/s
- HQ10 1680 m³/s
- HQ20 1900 m³/s
- HQ50 2150 m³/s
- HQ100 2350 m³/s
| Date | Mean value [m³/s] | Maximum [m³/s] | Minimum [m³/s] |
|---|---|---|---|
| 29.04.2024 | 295 | 297 | 291 |
| 28.04.2024 | 299 | 321 | 273 |
| 27.04.2024 | 304 | 315 | 288 |
| 26.04.2024 | 315 | 330 | 291 |
| 25.04.2024 | 311 | 327 | 291 |
| 24.04.2024 | 321 | 336 | 306 |
| 23.04.2024 | 364 | 387 | 333 |
© Bayerisches Landesamt für Umwelt 2024