
- Start >
- Rivers >
- Discharge >
- Untere Donau >
- Oberaudorf >
- Chart of total period

Chart of total period Oberaudorf / Inn
Discharge from 01.11.1900 to 30.04.2024
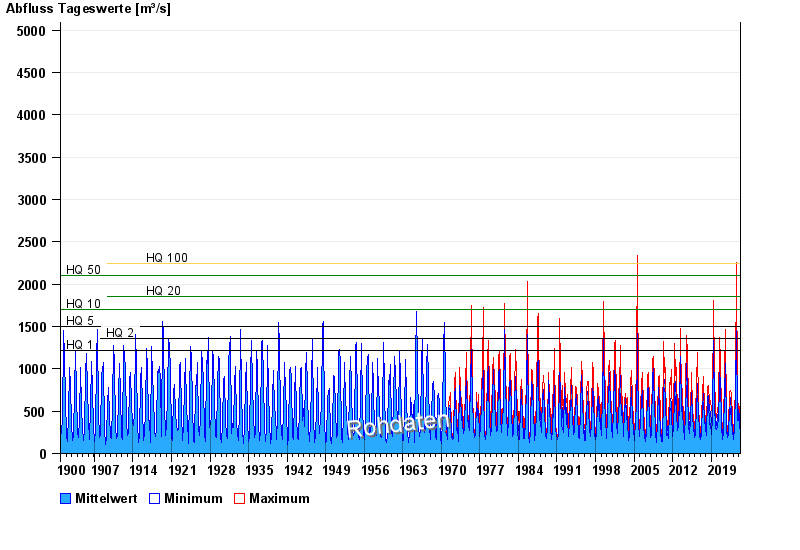
- HQ1 1220 m³/s
- HQ2 1360 m³/s
- HQ5 1500 m³/s
- HQ10 1700 m³/s
- HQ20 1850 m³/s
- HQ50 2100 m³/s
- HQ100 2250 m³/s
| Date | Mean value [m³/s] | Maximum [m³/s] | Minimum [m³/s] |
|---|---|---|---|
| 30.04.2024 | 294 | 297 | 287 |
| 29.04.2024 | 261 | 295 | 237 |
| 28.04.2024 | 252 | 292 | 214 |
| 27.04.2024 | 255 | 283 | 228 |
| 26.04.2024 | 235 | 252 | 212 |
| 25.04.2024 | 247 | 271 | 232 |
| 24.04.2024 | 263 | 292 | 230 |
© Bayerisches Landesamt für Umwelt 2024