
- Start >
- Rivers >
- Discharge >
- Untere Donau >
- Moosburg >
- Chart of year

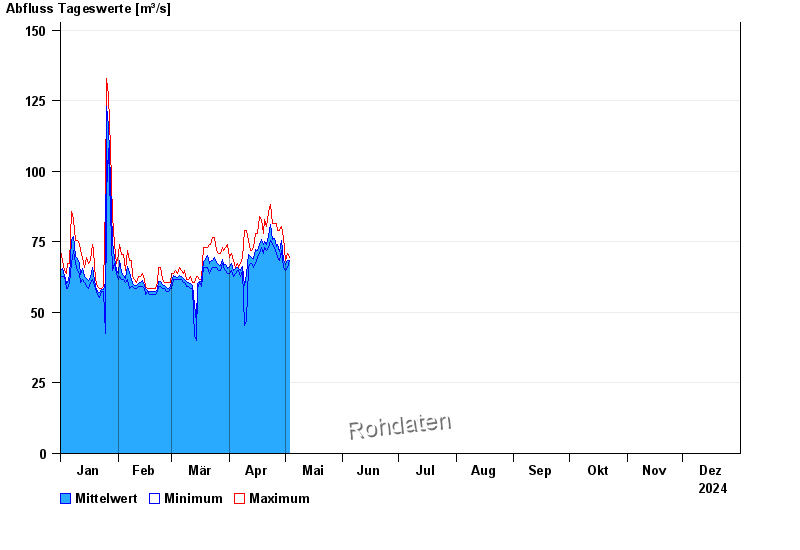
Chart of year Moosburg / Isar
Discharge from 01.01.2024 to 31.12.2024
| Date | Mean value [m³/s] | Maximum [m³/s] | Minimum [m³/s] |
|---|---|---|---|
| 08.06.2024 | 231 | 233 | 229 |
| 07.06.2024 | 216 | 235 | 183 |
| 06.06.2024 | 243 | 322 | 183 |
| 05.06.2024 | 386 | 426 | 325 |
| 04.06.2024 | 404 | 479 | 280 |
| 03.06.2024 | 272 | 320 | 243 |
| 02.06.2024 | 378 | 423 | 322 |
© Bayerisches Landesamt für Umwelt 2024