
- Start >
- Rivers >
- Discharge >
- Untere Donau >
- Leming >
- Chart of year

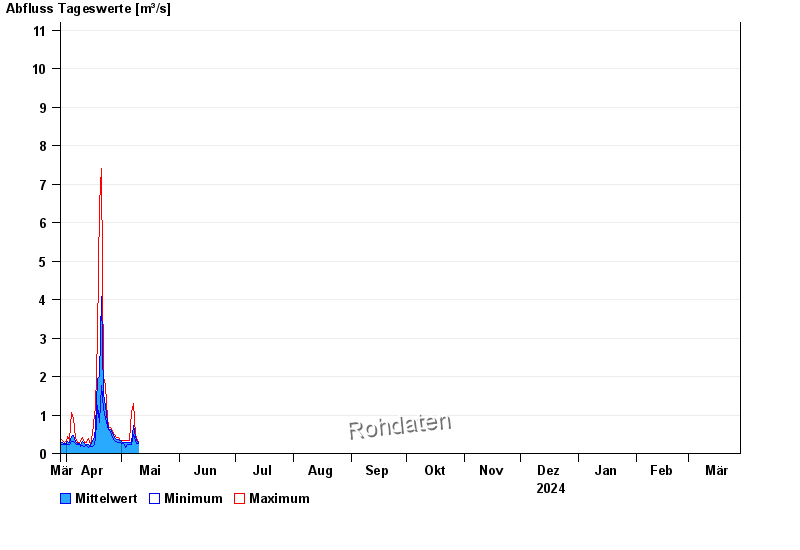
Chart of year Leming / Freybach
Discharge from 29.03.2024 to 28.03.2025
- 01.08.1991 Abfluss: 39,4 m³/s
- 17.05.2013 Abfluss: 18,9 m³/s
- 28.05.1986 Abfluss: 18,6 m³/s
- 08.08.1978 Abfluss: 18,6 m³/s
- 13.08.2002 Abfluss: 18 m³/s
| Date | Mean value [m³/s] | Maximum [m³/s] | Minimum [m³/s] |
|---|---|---|---|
| 14.05.2024 | 0.193 | 0.193 | 0.193 |
| 13.05.2024 | 0.231 | 0.287 | 0.193 |
| 12.05.2024 | 0.24 | 0.287 | 0.193 |
| 11.05.2024 | 0.262 | 0.287 | 0.213 |
| 10.05.2024 | 0.291 | 0.347 | 0.235 |
| 09.05.2024 | 0.348 | 0.381 | 0.26 |
| 08.05.2024 | 0.452 | 0.492 | 0.347 |
© Bayerisches Landesamt für Umwelt 2024