
- Start >
- Rivers >
- Discharge >
- Untere Donau >
- Leming >
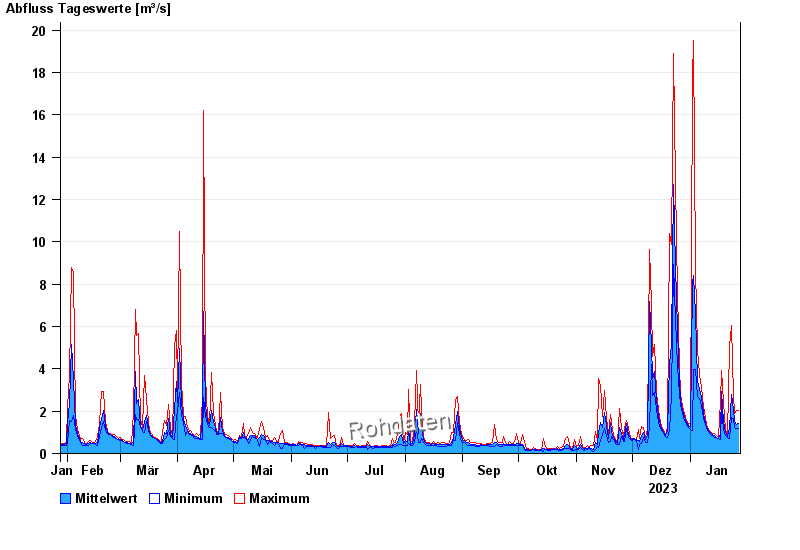
- Chart of year

Chart of year Leming / Freybach
Discharge from 28.01.2023 to 27.01.2024
| Date | Mean value [m³/s] | Maximum [m³/s] | Minimum [m³/s] |
|---|---|---|---|
| 27.01.2024 | 1.41 | 2.01 | 1.18 |
| 26.01.2024 | 1.35 | 2.01 | 1.18 |
| 25.01.2024 | 1.5 | 1.89 | 1.24 |
| 24.01.2024 | 2.07 | 2.75 | 1.64 |
| 23.01.2024 | 2.8 | 6.05 | 1.7 |
| 22.01.2024 | 1.16 | 5.04 | 0.711 |
| 21.01.2024 | 0.788 | 0.859 | 0.76 |
© Bayerisches Landesamt für Umwelt 2024