
- Start >
- Rivers >
- Discharge >
- Untere Donau >
- Leming >
- Chart of year

Chart of year Leming / Freybach
Discharge from 01.01.2021 to 31.12.2021
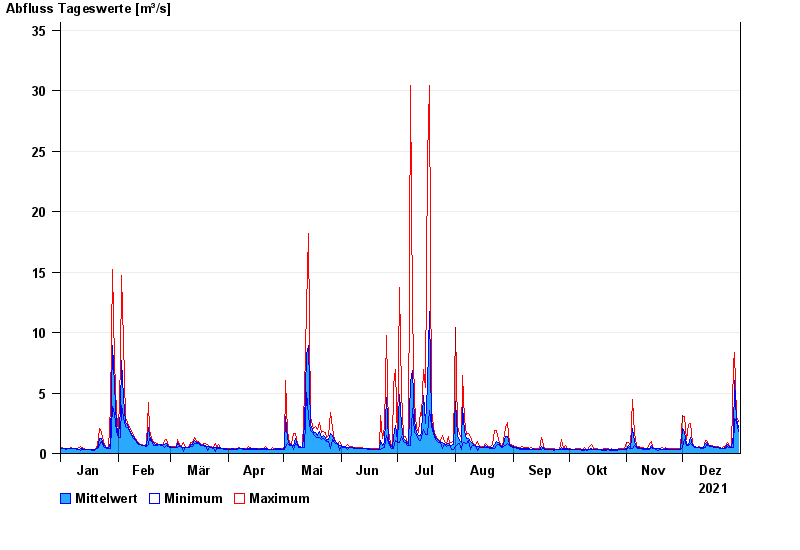
| Date | Mean value [m³/s] | Maximum [m³/s] | Minimum [m³/s] |
|---|---|---|---|
| 31.12.2021 | 2.19 | 2.61 | 1.83 |
| 30.12.2021 | 2.78 | 3.04 | 2.61 |
| 29.12.2021 | 6.02 | 8.35 | 2.9 |
| 28.12.2021 | 1.6 | 7.47 | 0.487 |
| 27.12.2021 | 0.528 | 0.562 | 0.487 |
| 26.12.2021 | 0.602 | 0.687 | 0.523 |
| 25.12.2021 | 0.768 | 0.875 | 0.601 |
© Bayerisches Landesamt für Umwelt 2024