
- Start >
- Rivers >
- Discharge >
- Untere Donau >
- Leming >
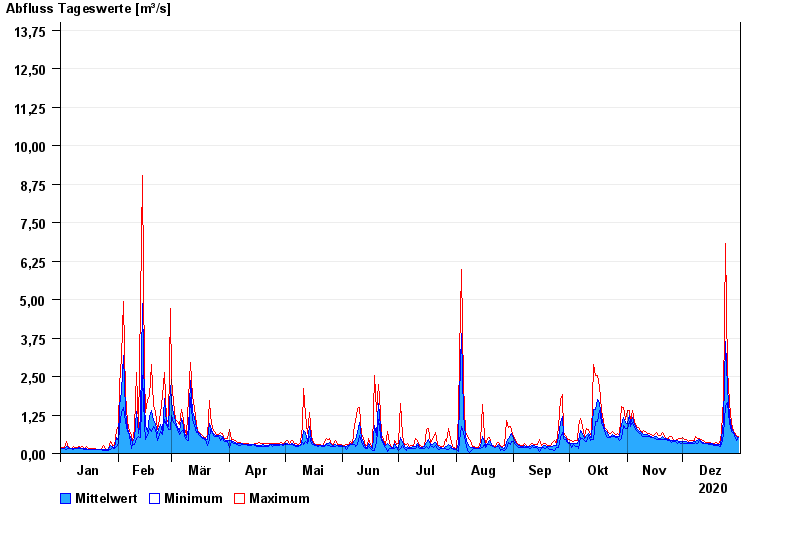
- Chart of year

Chart of year Leming / Freybach
Discharge from 01.01.2020 to 31.12.2020
- 01.08.1991 Abfluss: 39,4 m³/s
- 17.05.2013 Abfluss: 18,9 m³/s
- 28.05.1986 Abfluss: 18,6 m³/s
- 08.08.1978 Abfluss: 18,6 m³/s
- 13.08.2002 Abfluss: 18 m³/s
| Date | Mean value [m³/s] | Maximum [m³/s] | Minimum [m³/s] |
|---|---|---|---|
| 31.12.2020 | 0.515 | 0.549 | 0.507 |
| 30.12.2020 | 0.556 | 0.592 | 0.427 |
| 29.12.2020 | 0.631 | 0.68 | 0.589 |
| 28.12.2020 | 0.71 | 0.726 | 0.678 |
| 27.12.2020 | 0.828 | 0.977 | 0.724 |
| 26.12.2020 | 1.21 | 1.66 | 0.977 |
| 25.12.2020 | 2.15 | 2.7 | 1.66 |
© Bayerisches Landesamt für Umwelt 2024