
- Start >
- Rivers >
- Discharge >
- Untere Donau >
- Leming >
- Chart of year

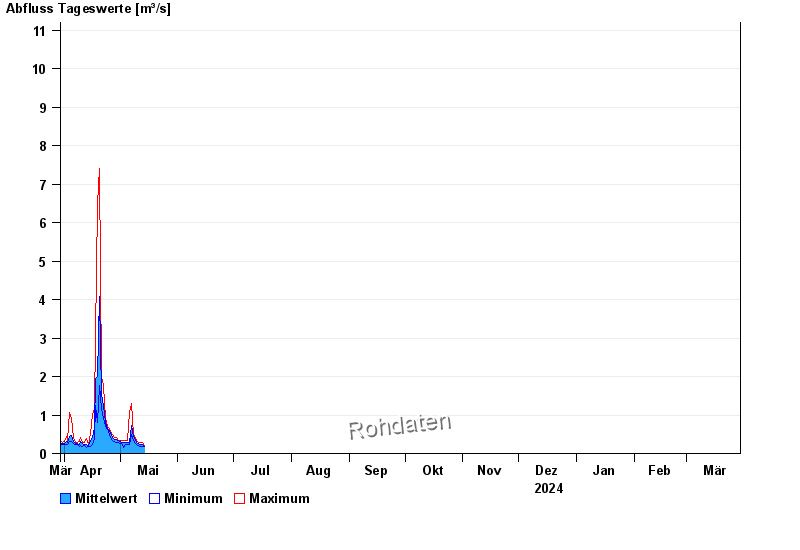
Chart of year Leming / Freybach
Discharge from 30.03.2024 to 29.03.2025
- 01.08.1991 Abfluss: 39,4 m³/s
- 17.05.2013 Abfluss: 18,9 m³/s
- 28.05.1986 Abfluss: 18,6 m³/s
- 08.08.1978 Abfluss: 18,6 m³/s
- 13.08.2002 Abfluss: 18 m³/s
| Date | Mean value [m³/s] | Maximum [m³/s] | Minimum [m³/s] |
|---|---|---|---|
| 29.04.2024 | 0.347 | 0.347 | 0.347 |
| 28.04.2024 | 0.372 | 0.416 | 0.316 |
| 27.04.2024 | 0.427 | 0.492 | 0.347 |
| 26.04.2024 | 0.516 | 0.576 | 0.416 |
| 25.04.2024 | 0.616 | 0.666 | 0.576 |
| 24.04.2024 | 0.661 | 0.711 | 0.619 |
| 23.04.2024 | 0.815 | 0.911 | 0.711 |
© Bayerisches Landesamt für Umwelt 2024