
- Start >
- Rivers >
- Discharge >
- Untere Donau >
- Langengeisling >
- Chart of year

Chart of year Langengeisling / Sempt
Discharge from 01.01.2024 to 31.12.2024
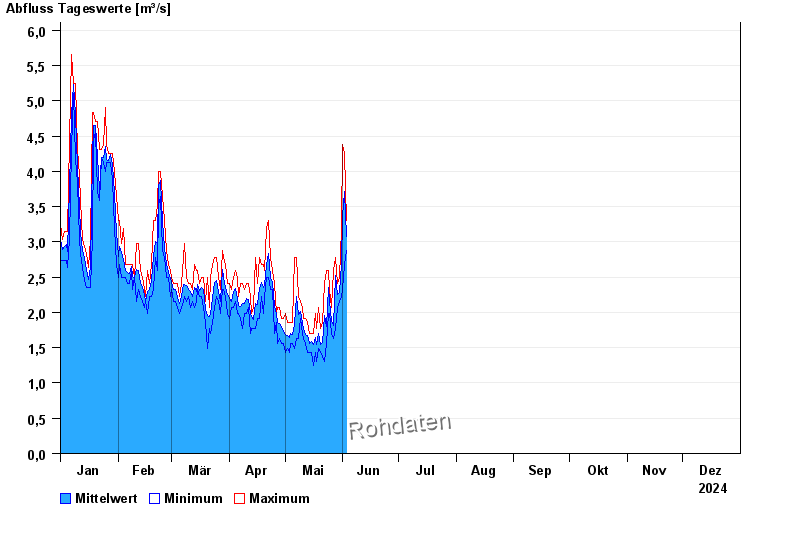
| Date | Mean value [m³/s] | Maximum [m³/s] | Minimum [m³/s] |
|---|---|---|---|
| 23.05.2024 | 1.77 | 1.99 | 1.56 |
| 22.05.2024 | 1.96 | 2.41 | 1.37 |
| 21.05.2024 | 1.58 | 1.85 | 1.37 |
| 20.05.2024 | 1.55 | 1.77 | 1.43 |
| 19.05.2024 | 1.7 | 2.07 | 1.49 |
| 18.05.2024 | 1.55 | 1.77 | 1.31 |
| 17.05.2024 | 1.64 | 1.99 | 1.43 |
© Bayerisches Landesamt für Umwelt 2024