
- Start >
- Rivers >
- Discharge >
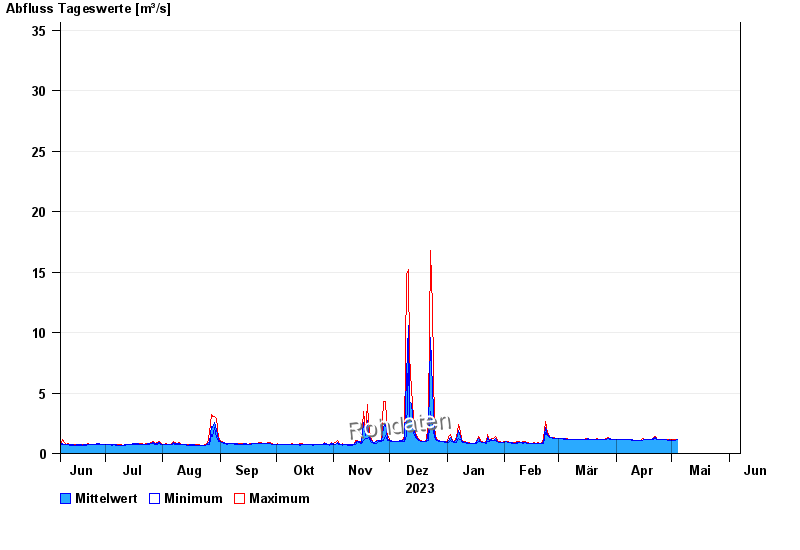
- Untere Donau >
- Landshut Flutmulde >
- Chart of year

Chart of year Landshut Flutmulde / Isar
Discharge from 07.06.2023 to 06.06.2024
 Für diesen Pegel sind keine Jährlichkeiten hinterlegt.
| Date | Mean value [m³/s] | Maximum [m³/s] | Minimum [m³/s] |
|---|---|---|---|
| 01.06.2024 | 6.79 | 8.57 | 5.07 |
| 31.05.2024 | 2.28 | 4.94 | 1.56 |
| 30.05.2024 | 1.63 | 1.66 | 1.56 |
| 29.05.2024 | 1.69 | 1.87 | 1.61 |
| 28.05.2024 | 3.11 | 5.21 | 1.87 |
| 27.05.2024 | 1.4 | 2.51 | 1.34 |
| 26.05.2024 | 1.37 | 1.38 | 1.34 |
© Bayerisches Landesamt für Umwelt 2024