
- Start >
- Rivers >
- Discharge >
- Untere Donau >
- Kothmaißling >
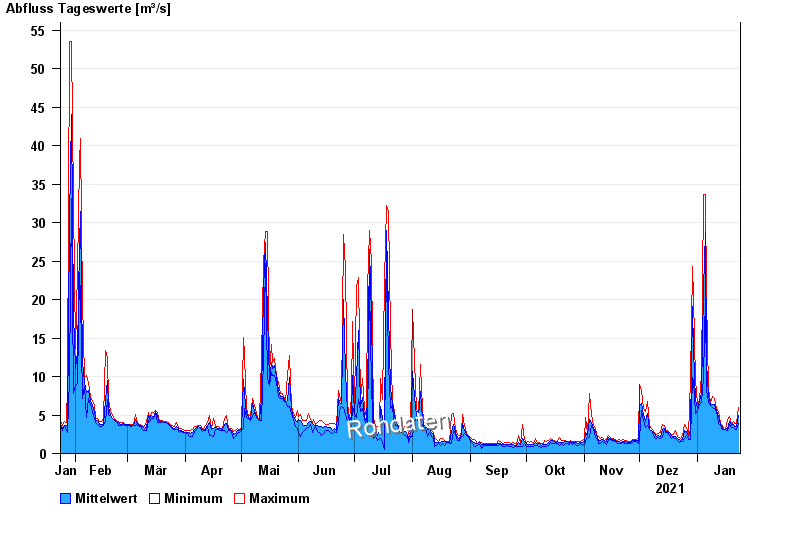
- Chart of year

Chart of year Kothmaißling / Chamb
Discharge from 24.01.2021 to 23.01.2022
note
Beeinflussung durch Buhneneinbau unterhalb vom Pegel
| Date | Mean value [m³/s] | Maximum [m³/s] | Minimum [m³/s] |
|---|---|---|---|
| 23.01.2022 | 4.91 | 5.99 | 3.94 |
| 22.01.2022 | 3.48 | 3.94 | 3.09 |
| 21.01.2022 | 3.57 | 3.94 | 3.26 |
| 20.01.2022 | 3.75 | 4.11 | 3.42 |
| 19.01.2022 | 3.6 | 3.76 | 3.42 |
| 18.01.2022 | 4.1 | 4.84 | 3.76 |
| 17.01.2022 | 3.28 | 4.48 | 2.94 |
© Bayerisches Landesamt für Umwelt 2024