
- Start >
- Rivers >
- Discharge >
- Untere Donau >
- Kothmaißling >
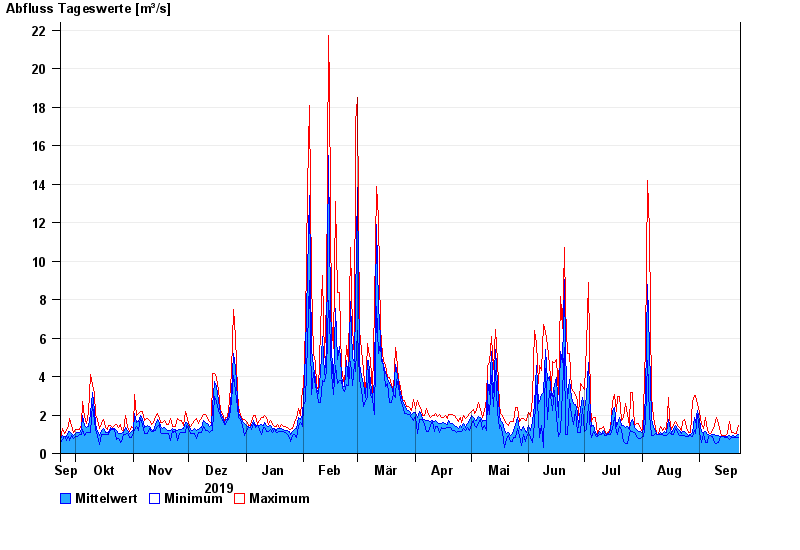
- Chart of year

Chart of year Kothmaißling / Chamb
Discharge from 23.09.2019 to 22.09.2020
note
Beeinflussung durch Buhneneinbau unterhalb vom Pegel
| Date | Mean value [m³/s] | Maximum [m³/s] | Minimum [m³/s] |
|---|---|---|---|
| 22.09.2020 | 1.01 | 1.47 | 0.81 |
| 21.09.2020 | 0.919 | 1.03 | 0.81 |
| 20.09.2020 | 0.886 | 1.03 | 0.81 |
| 19.09.2020 | 0.928 | 1.11 | 0.81 |
| 18.09.2020 | 0.905 | 1.11 | 0.81 |
| 17.09.2020 | 0.952 | 1.67 | 0.746 |
| 16.09.2020 | 0.895 | 1.03 | 0.81 |
© Bayerisches Landesamt für Umwelt 2024