
- Start >
- Rivers >
- Discharge >
- Untere Donau >
- Kothmaißling >
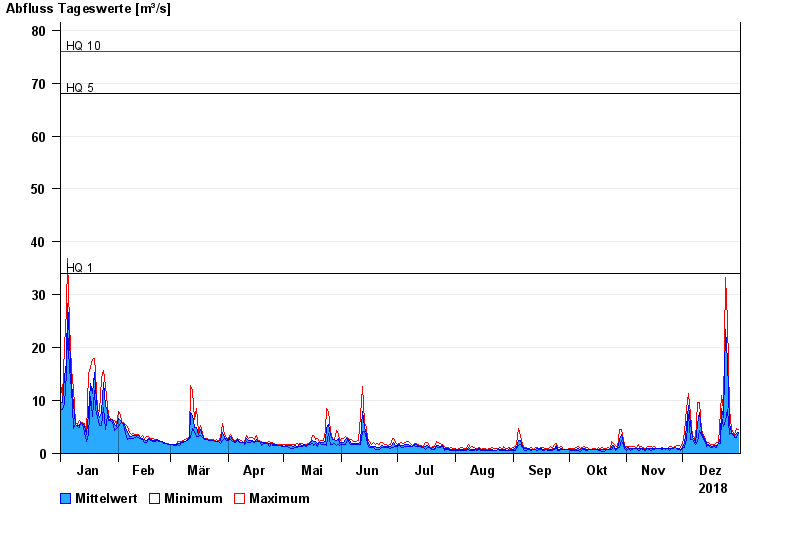
- Chart of year

Chart of year Kothmaißling / Chamb
Discharge from 01.01.2018 to 31.12.2018
note
Beeinflussung durch Buhneneinbau unterhalb vom Pegel
- HQ1 34 m³/s
- HQ5 68 m³/s
- HQ10 76 m³/s
- HQ20 84 m³/s
- HQ50 93 m³/s
- HQ100 101 m³/s
| Date | Mean value [m³/s] | Maximum [m³/s] | Minimum [m³/s] |
|---|---|---|---|
| 31.12.2018 | 3.99 | 4.58 | 3.71 |
| 30.12.2018 | 3.82 | 4.77 | 3.06 |
| 29.12.2018 | 3.34 | 3.54 | 3.06 |
| 28.12.2018 | 3.67 | 3.87 | 3.54 |
| 27.12.2018 | 4.05 | 4.58 | 3.7 |
| 26.12.2018 | 5.76 | 8.28 | 3.53 |
| 25.12.2018 | 17.5 | 25 | 8.28 |
© Bayerisches Landesamt für Umwelt 2024