
- Start >
- Rivers >
- Discharge >
- Untere Donau >
- Kothmaißling >
- Chart of year

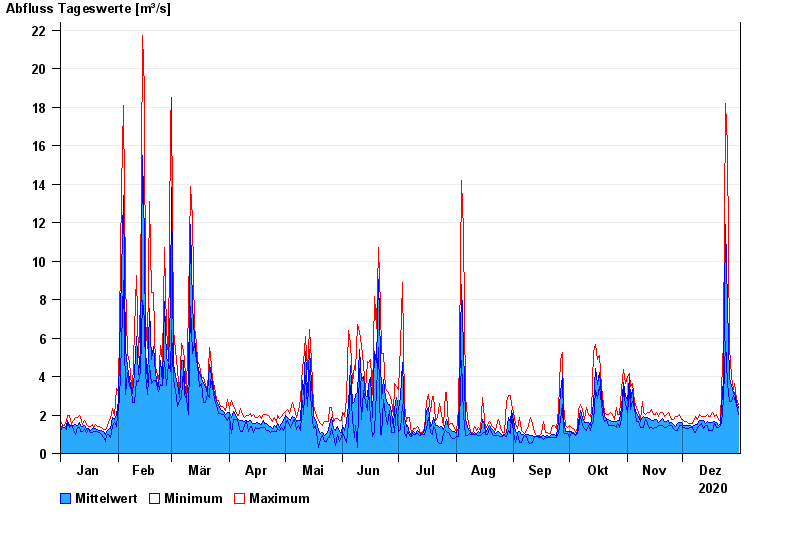
Chart of year Kothmaißling / Chamb
Discharge from 01.01.2020 to 31.12.2020
note
Beeinflussung durch Buhneneinbau unterhalb vom Pegel
| Date | Mean value [m³/s] | Maximum [m³/s] | Minimum [m³/s] |
|---|---|---|---|
| 31.12.2020 | 2.38 | 2.54 | 2.02 |
| 30.12.2020 | 2.65 | 2.84 | 2.54 |
| 29.12.2020 | 3.16 | 3.64 | 2.84 |
| 28.12.2020 | 3.11 | 3.31 | 2.99 |
| 27.12.2020 | 3.56 | 3.98 | 2.69 |
| 26.12.2020 | 3.88 | 5.46 | 2.69 |
| 25.12.2020 | 7.72 | 16 | 3.64 |
© Bayerisches Landesamt für Umwelt 2024