
- Start >
- Rivers >
- Discharge >
- Untere Donau >
- Kothmaißling >
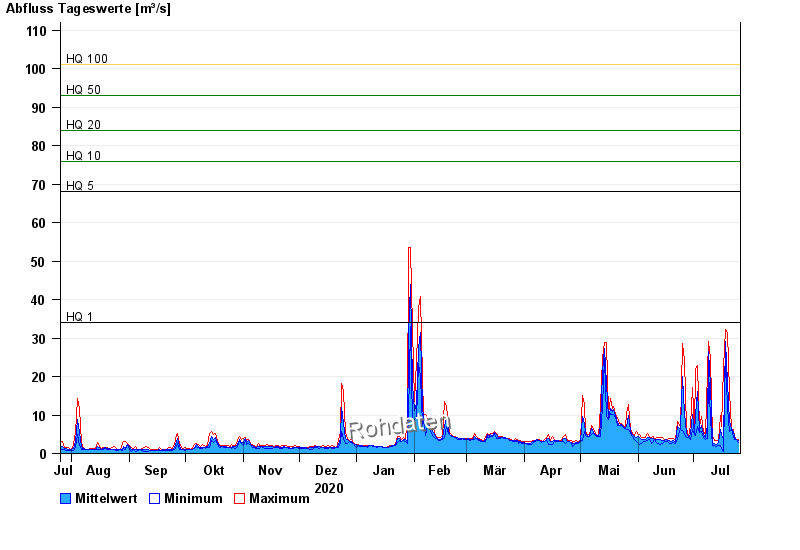
- Chart of year

Chart of year Kothmaißling / Chamb
Discharge from 26.07.2020 to 25.07.2021
note
Beeinflussung durch Buhneneinbau unterhalb vom Pegel
- HQ1 34 m³/s
- HQ5 68 m³/s
- HQ10 76 m³/s
- HQ20 84 m³/s
- HQ50 93 m³/s
- HQ100 101 m³/s
| Date | Mean value [m³/s] | Maximum [m³/s] | Minimum [m³/s] |
|---|---|---|---|
| 25.07.2021 | 3.22 | 3.58 | 2.75 |
| 24.07.2021 | 3.55 | 3.56 | 3.54 |
| 23.07.2021 | 4.13 | 4.43 | 3.54 |
| 22.07.2021 | 5.64 | 6.13 | 4.42 |
| 21.07.2021 | 6.36 | 6.5 | 6.11 |
| 20.07.2021 | 8.22 | 15.7 | 5.69 |
| 19.07.2021 | 18.2 | 31.2 | 11.3 |
© Bayerisches Landesamt für Umwelt 2024