
- Start >
- Rivers >
- Discharge >
- Untere Donau >
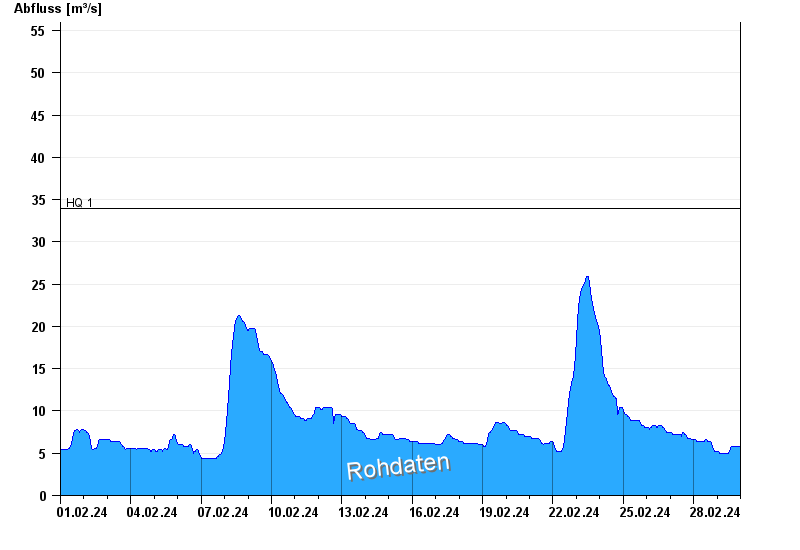
- Kothmaißling >
- Chart of month

Chart of month Kothmaißling / Chamb
Discharge from 01.02.2024 to 29.02.2024
note
Beeinflussung durch Buhneneinbau unterhalb vom Pegel
- HQ1 34 m³/s
- HQ5 68 m³/s
- HQ10 76 m³/s
- HQ20 84 m³/s
- HQ50 93 m³/s
- HQ100 101 m³/s
| Date | Runoff [m³/s] |
|---|---|
| 29.02.2024 23:45 | 5.59 |
| 29.02.2024 23:30 | 5.59 |
| 29.02.2024 23:15 | 5.59 |
| 29.02.2024 23:00 | 5.59 |
| 29.02.2024 22:45 | 5.79 |
| 29.02.2024 22:30 | 5.59 |
| 29.02.2024 22:15 | 5.79 |
© Bayerisches Landesamt für Umwelt 2024